

























The US Dollar is trading lower against the Swiss Franc (CHF) on Thursday, as investors ponder the consequences of reciprocal US and Iran attacks and a 10% rebound in Oil prices, on the major central banks’ monetary policies. The USD/CHF pair has retreated to levels near 0.8050 after being rejected at 0.8100 on Wednesday.
The Swiss Franc is drawing some support from a mild US Dollar weakness, as the Dollar Index (DXY) dips below 101.00 to test weekly lows. Investors sold the Greenback across the board on Wednesday, following the release of the Federal Reserve’s minutes, unimpressed with the central bank’s commitment to bring inflationary pressures back to target.
Geopolitical tensions are also failing to support the safe-haven US Dollar on Thursday. A second round of reciprocal attacks between the US and Iran cast further doubt on a negotiated end of the war, and have boosted a nearly 10% increase in Oil prices. Investors, however, remain hopeful that Washington and Tehran will return to the negotiating table, which is keeping USD bulls subdued so far.
Technical Analysis: In a bearish correction from June’s highs
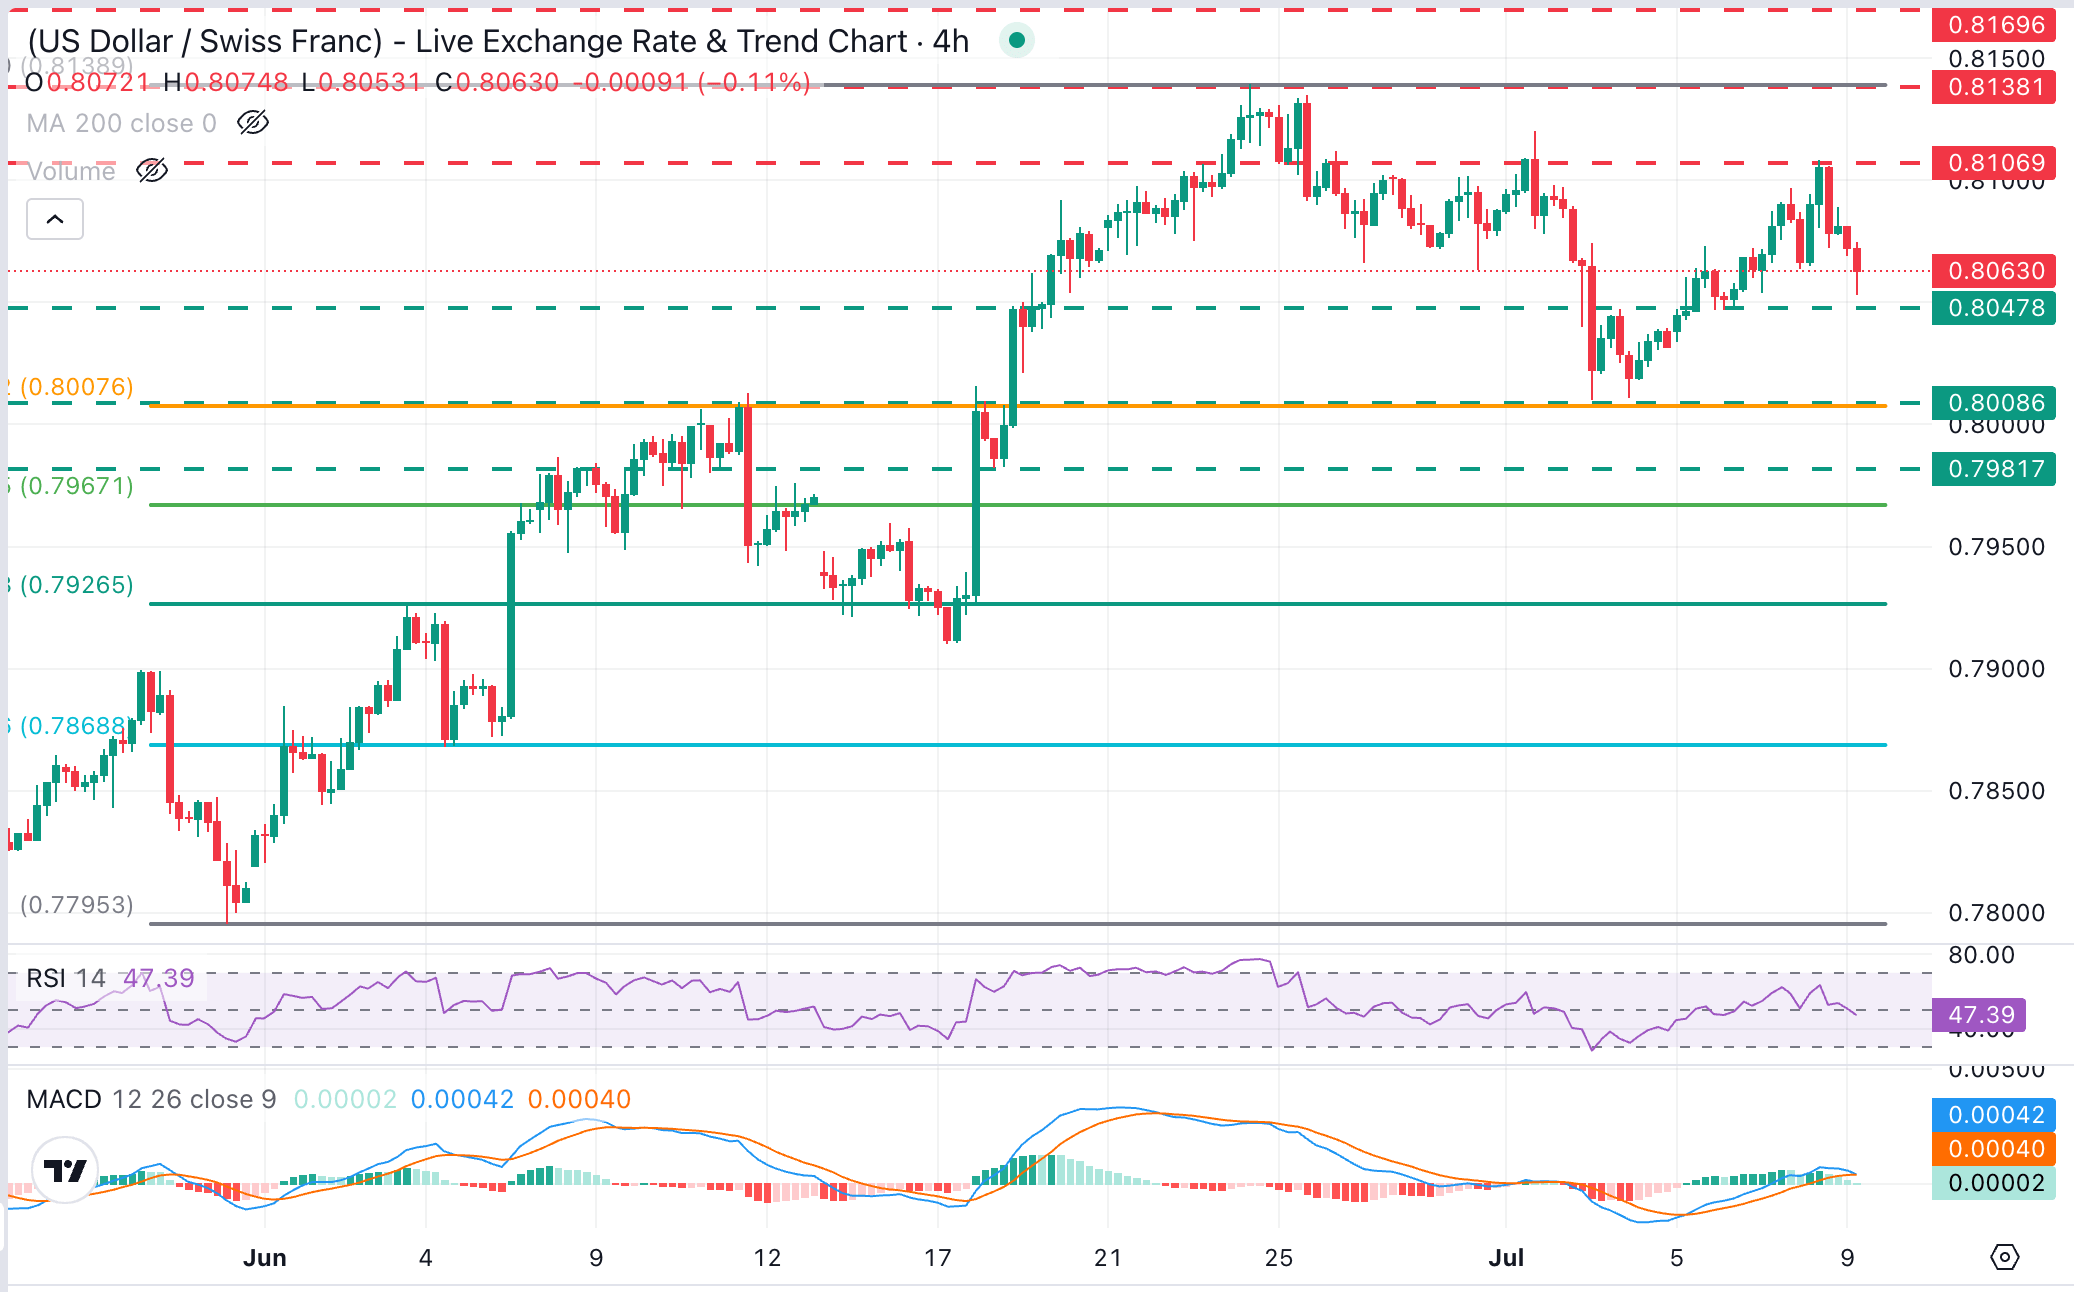
The USD/CHF printed a lower high on Wednesday, at 0.8108, confirming that the corrective phase from late-June highs remains in play. Momentum indicators in four-hour charts show a weakening stance, with the Relative Strength Index (14) entering bearish territory at 46.1 and the Moving Average Convergence Divergence (MACD) slipping back towards the zero line, hinting at fading bullish momentum.
The pair is likely to find some support above the July 7 lows near 0.8045, although the key support level is at the 0.8000 psychological area, where the July 2 and 3 lows meet the 38.6% Fibonacci retracement of June’s rally.
On the topside, initial resistance is located at July’s peaks, in the 0.8110-0.8120 area. A confirmation above these levels would hint at the end of the corrective phase and expose the one-year high, at 0.8139, hit on June 24.
(The technical analysis of this story was written with the help of an AI tool. Know more.)
US Dollar Price Today
The table below shows the percentage change of US Dollar (USD) against listed major currencies today. US Dollar was the strongest against the Canadian Dollar.
| USD | EUR | GBP | JPY | CAD | AUD | NZD | CHF | |
|---|---|---|---|---|---|---|---|---|
| USD | -0.17% | -0.22% | -0.16% | -0.03% | -0.11% | -0.50% | -0.24% | |
| EUR | 0.17% | -0.05% | 0.00% | 0.14% | 0.08% | -0.30% | -0.06% | |
| GBP | 0.22% | 0.05% | 0.04% | 0.18% | 0.12% | -0.26% | -0.01% | |
| JPY | 0.16% | 0.00% | -0.04% | 0.11% | 0.08% | -0.33% | -0.07% | |
| CAD | 0.03% | -0.14% | -0.18% | -0.11% | -0.05% | -0.44% | -0.19% | |
| AUD | 0.11% | -0.08% | -0.12% | -0.08% | 0.05% | -0.38% | -0.15% | |
| NZD | 0.50% | 0.30% | 0.26% | 0.33% | 0.44% | 0.38% | 0.25% | |
| CHF | 0.24% | 0.06% | 0.00% | 0.07% | 0.19% | 0.15% | -0.25% |
The heat map shows percentage changes of major currencies against each other. The base currency is picked from the left column, while the quote currency is picked from the top row. For example, if you pick the US Dollar from the left column and move along the horizontal line to the Japanese Yen, the percentage change displayed in the box will represent USD (base)/JPY (quote).
Source: Original Article