






















H1 2026 Silver Price Review: Trend Pullback After an Extreme Surge
In H1 2026, silver prices exhibited an extreme “spike-top inverted-V, step-down” pattern, driven primarily by the interplay of two major themes: unusual movements in spot market fundamentals and a shift in the US Federal Reserve’s monetary policy. Early in the year, a squeeze in the spot market unfolded, with loose monetary expectations providing valuation support, collectively pushing silver prices to a record high of 30,900 yuan/kg. Subsequently, expectations for interest rate cuts reversed from being fully priced in to evaporating entirely, as persistently above-expected inflation reinforced tightening expectations. Silver prices entered a downward trajectory, hitting a half-year low of 13,816 yuan/kg in June, a 55% pullback from the peak.
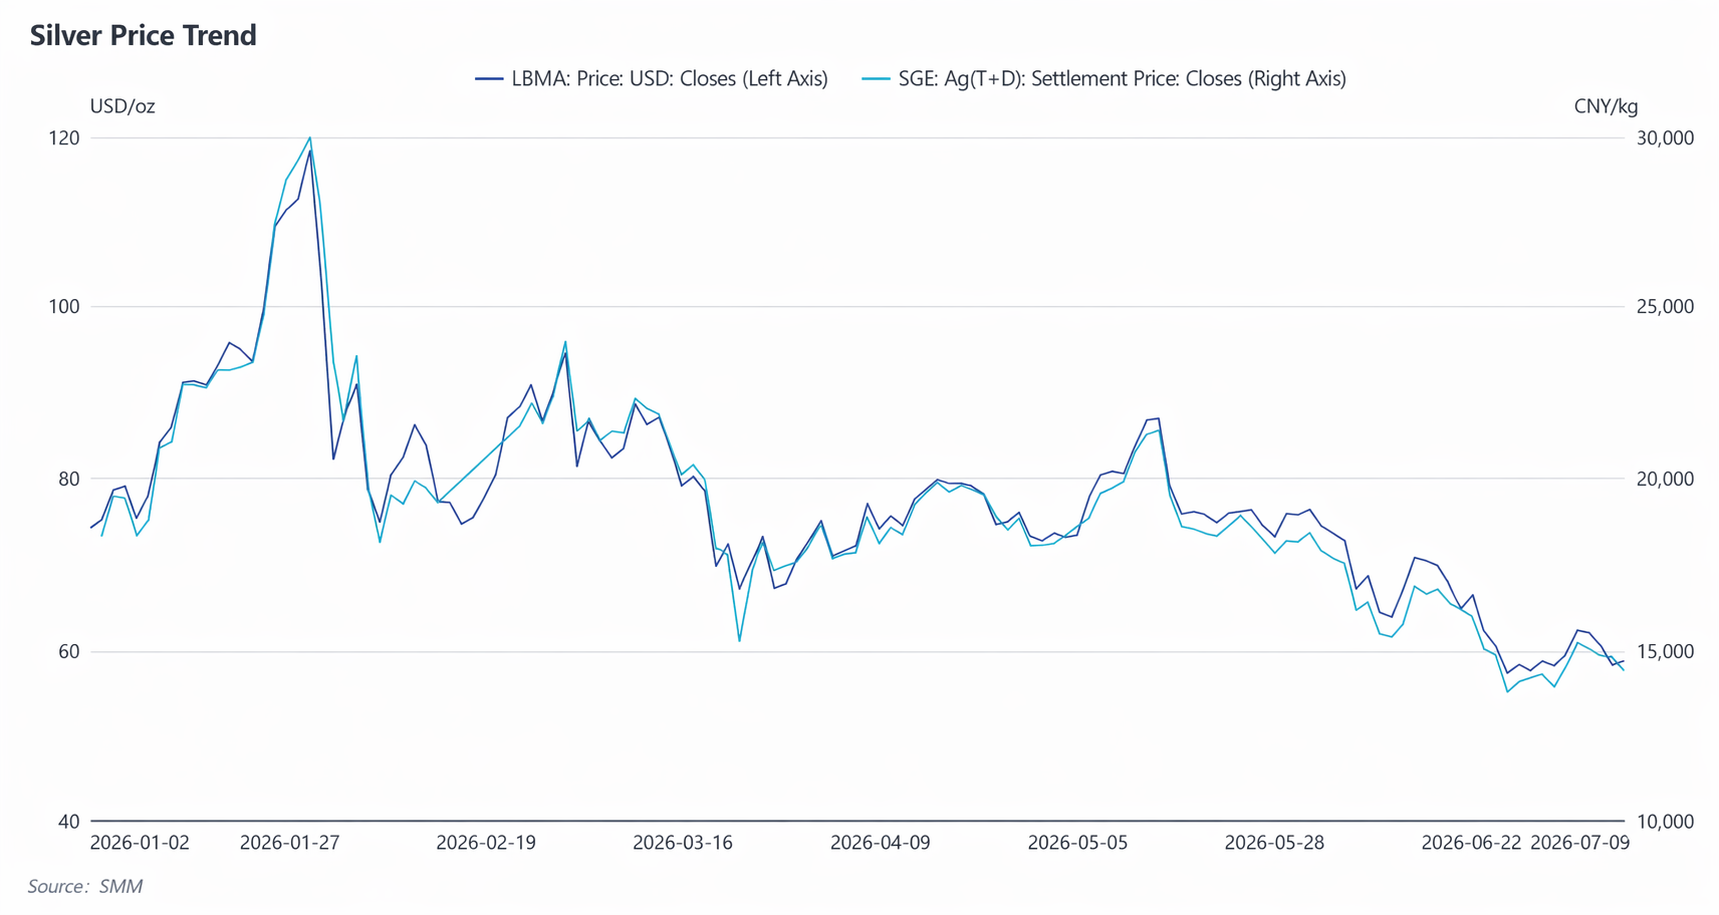
January-February: Squeeze Sentiment Drove the Surge, Loose Policy Expectations Provided Macro Valuation Floor.At the start of the year, the market continued its earlier loose-trade logic, generally expecting the US Fed to begin cutting interest rates within the year. A periodical weakening of the US dollar provided a floor for the overall precious metals sector. In late January, spot circulation of SHFE silver tightened significantly, creating a rare backwardation structure, and the risk of a short squeeze escalated rapidly. The resonance of fundamental and macro fronts pushed silver prices to a historical high. After a single-day plunge in early February, prices rebounded quickly and consolidated above 25,000 yuan/kg. In mid-month, the exchange intensified risk control measures, and the squeeze sentiment gradually subsided, bringing the extreme surge to a temporary halt.
March-April: Rate Cut Expectations Continued to Cool, Silver Prices Began a Trend Pullback.In March, sticky US inflation became increasingly evident, causing the market to continuously scale back bets on US Fed rate cuts. The loose trade rapidly faded, and silver prices officially entered a downward trajectory, probing above 16,000 yuan/kg within the month. The market then entered a tug-of-war between longs and shorts; amid fluctuating expectations, silver prices stabilized and rebounded temporarily. In April, prices overall consolidated within a range, lacking a clear directional breakthrough as the market awaited further signals from inflation and employment data.
May-June: Policy Expectations Completely Reversed, Hawkish Signals and Above-Expected Inflation Accelerated the Bottoming Process.In May, both US CPI and PPI data exceeded expectations, and the job market proved surprisingly strong, dashing market hopes for rate cuts. Major institutions successively lowered and ultimately erased their full-year rate cut forecasts, shifting the market consensus rapidly from a “rate-cutting cycle” to “higher for longer.” Silver prices subsequently resumed their decline. In June, the US Fed’s FOMC meeting formally confirmed the policy shift; the dot plot indicated no rate cuts within the year. US Treasury yields and the US dollar index rose in tandem, continuously weighing on silver’s monetary attributes. Silver prices accelerated their decline, ultimately dropping to a half-year low of 13,816 yuan/kg, a 55% drop from the peak.
H1 2026 Silver Mine Supply Review: Peru Incident Sparked Supply Concerns, Rising Imports Supported Domestic Raw Material Supply
International Mine Supply Disruption: Peru Mine Disruption Spurred a 7.3% Single-Day Surge in Silver Prices
On May 11, 2026, the Peruvian Presidential Office issued Emergency Decree No. 003-2026. Due to a persistent energy crisis, some small and medium-sized mines and high-cost operations with weaker risk resilience faced the risk of production cuts or temporary shutdowns. Driven by both Peru’s energy crisis and the escalation of the Middle East situation, the LBMA spot silver price surged by approximately 7.3% in a single day, hitting $86.10/oz.
According to SMM survey analysis, Peru holds a dominant position in global mined silver supply, with small and medium-sized mines accounting for as much as 75% of its domestic projects. Meanwhile, Peru accounts for half of China’s imported silver-containing concentrates. Once a material shortage emerges on the supply side, it would cause a significant supply shock to both China and non-China markets. However, this incident remained largely at the sentiment-driven trading stage based on news, and has yet to form sustained, data-supported supply disruption.
Import Market: Imports Surged in H1, Full-Year Growth Expected to Exceed 20%
In May 2026, China’s imports of silver-containing concentrates were 190,000 mt, down 15.8% MoM. Cumulative imports from January to May reached 946,000 mt, up 30.4% YoY. The sustained surge in imports in H1 this year was mainly because a persistent price spread between SGE and LBMA spot silver prices attracted overseas miners to increase exports to China. Since May, this spread narrowed, and import volumes pulled back accordingly.
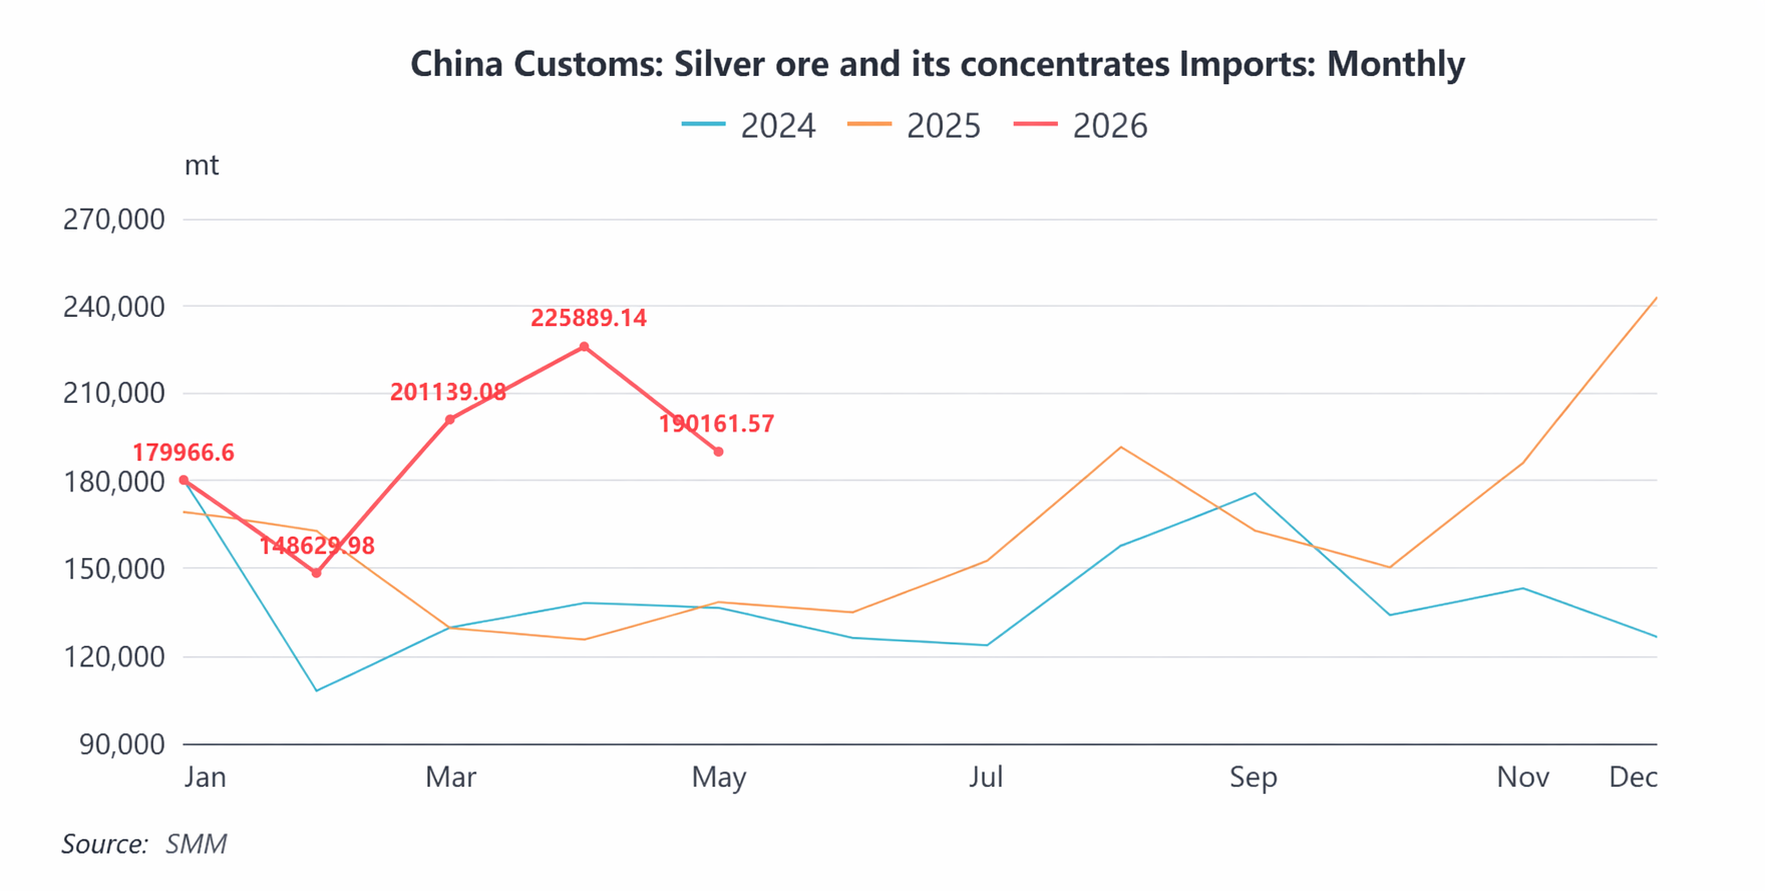
China’s imports of silver-containing ore hit 1.94 million mt in physical content in 2025, up 16% YoY. Coupled with the above-expected incremental growth brought by the price spread in H1 this year, imports of silver-containing ore are expected to maintain a growth rate exceeding 20% for full-year 2026.
H1 2026 Silver Ingot Market Review: Stable Supply Growth, Import Surge and Subsequent Normalization, Reshaping of Demand Structure
Supply Side: Silver Ingot Production Up 6.9% YoY, Full-Year Volume Expected to Reach Approximately 20,000 mt
In H1 2026, national silver ingot production showed a trend of rising first then stabilizing. According to SMM data, June’s single-month output was 1,562 mt, down 6.5% MoM, mainly affected by concentrated maintenance among copper smelters and phased production halts at some producers. Cumulative production from January to June reached 9,773 mt, up 6.9% YoY, maintaining steady overall output growth.
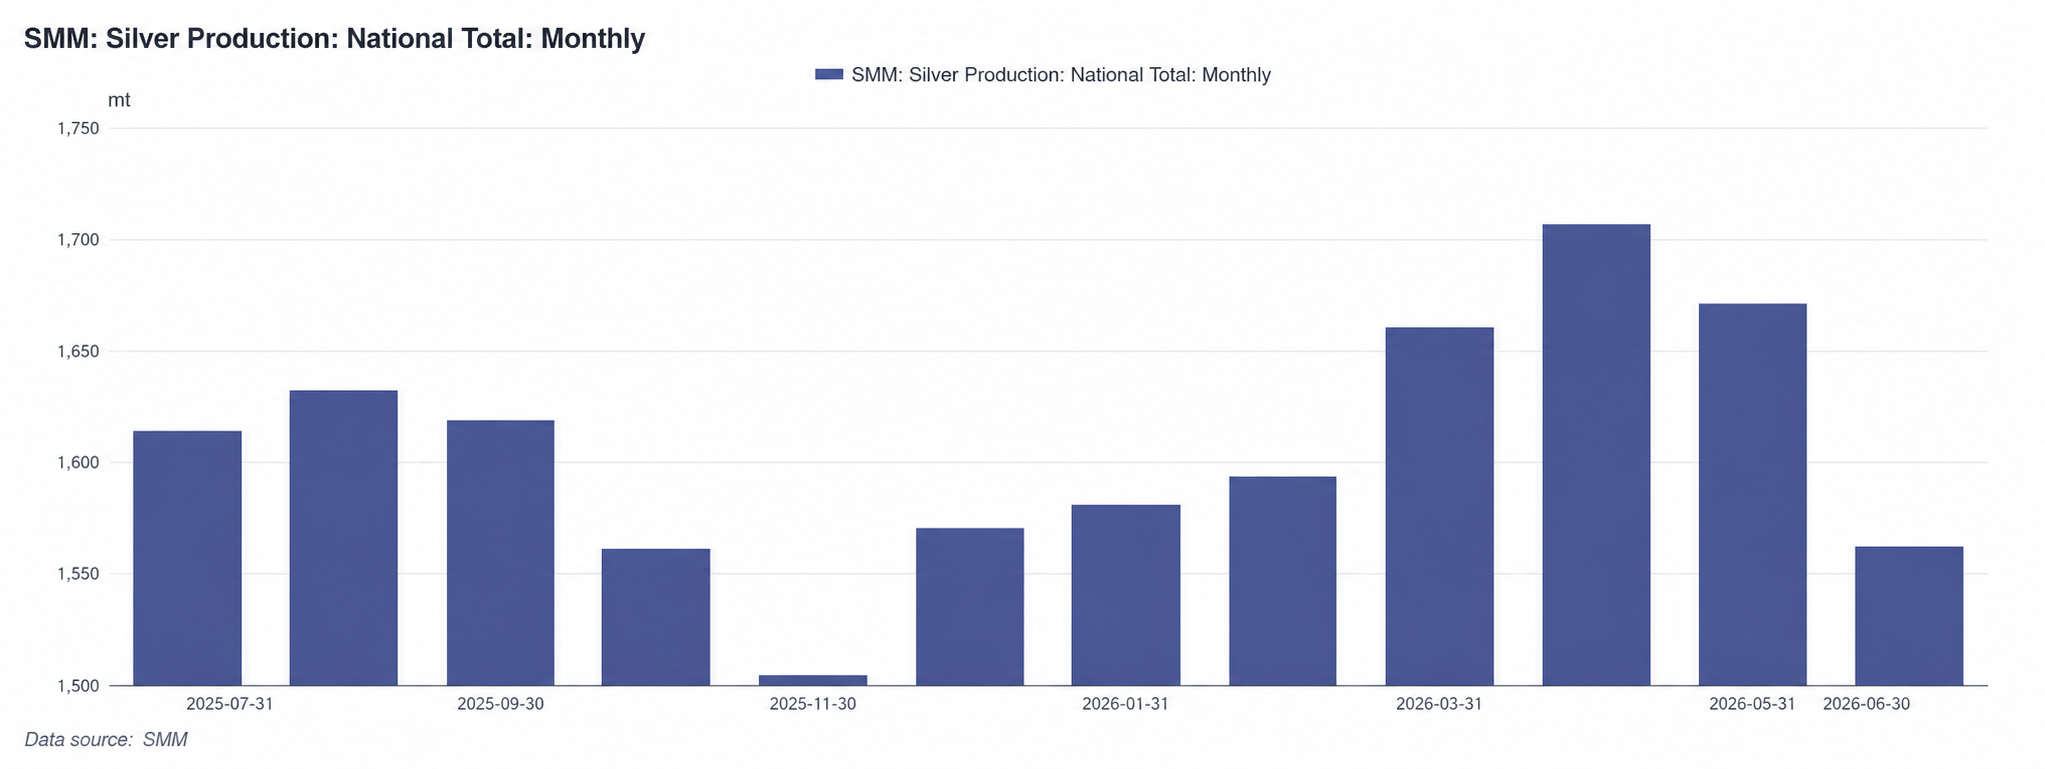
From a full-year perspective, domestic mined silver supply is basically stable, and imports of silver-containing concentrates continue to grow. Coupled with increased by-product silver value and improved overall recovery rates, some enterprises’ precious and rare metal production lines plan to commence production in H2. Full-year 2026 silver ingot production is expected to reach approximately 20,000 mt, a YoY increase of about 7%, with a further acceleration in production growth compared to the 18,600 mt of SMM No.1 silver output in 2025. May to June is the traditional maintenance season for copper concentrates and lead concentrates. The recent periodic contraction on the supply side is normal seasonal fluctuations and is expected to recover gradually from July to August. Overall, silver ingot supply fundamentals were robust in H1, laying a solid foundation for market operations in H2.
Exports and Imports: Imports Normalized After Surging, Attention on Indian Tariff Disruptions in H2
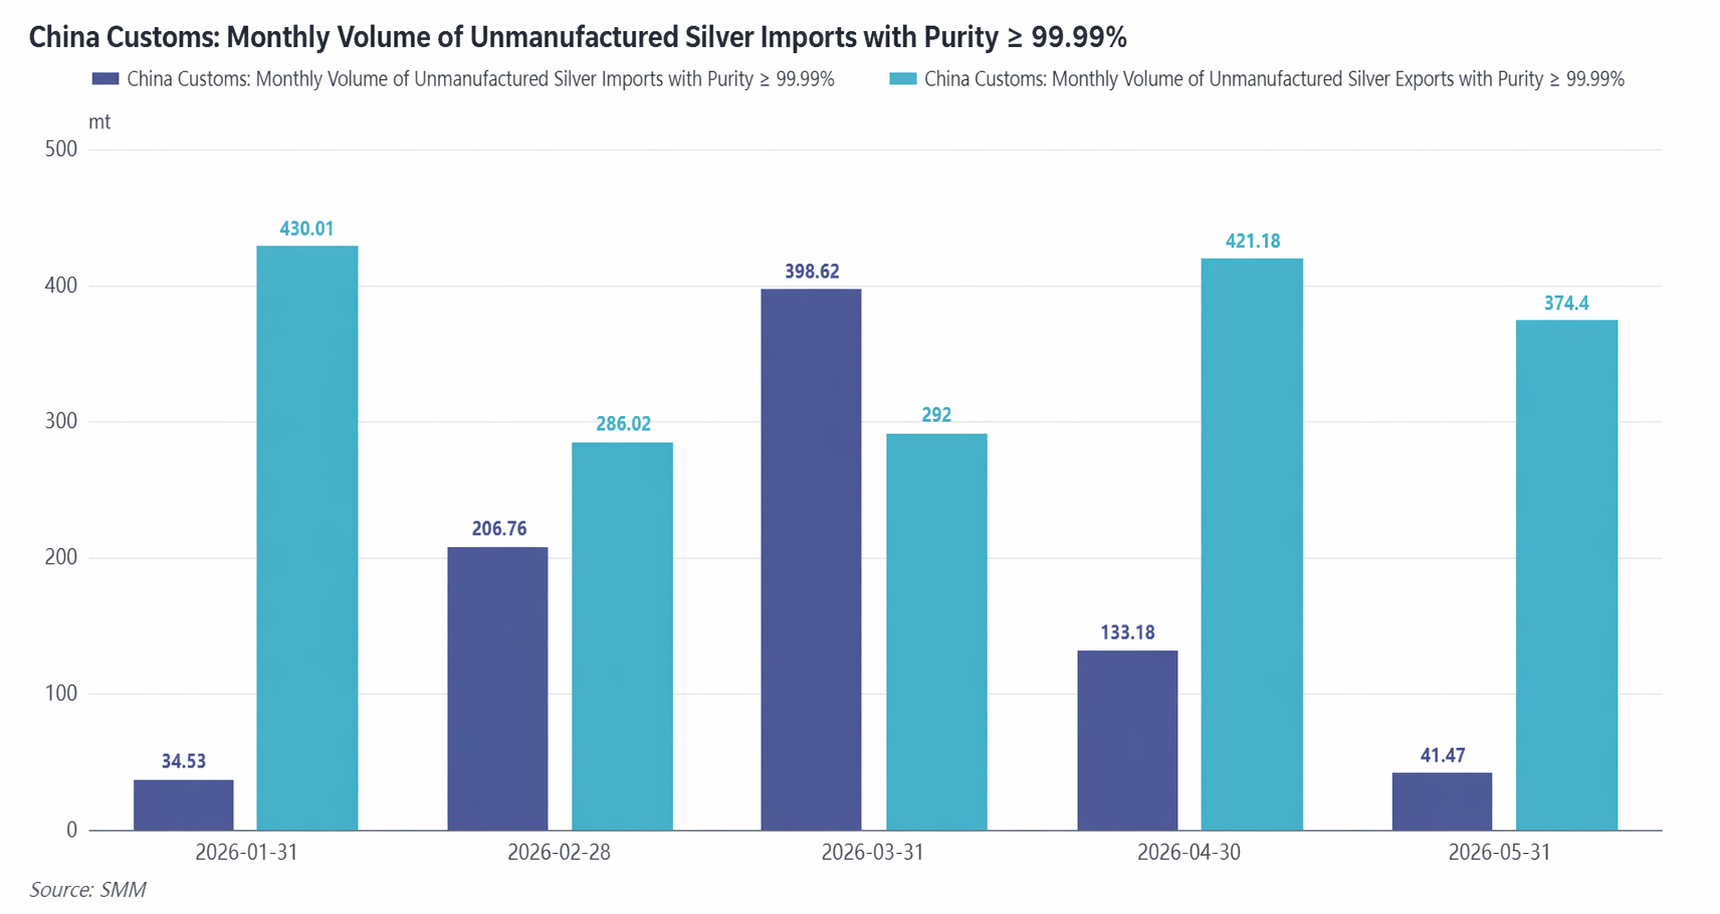
On the export front, cumulative exports of refined silver from January to May 2026 reached 1,803 mt, down 3.38% YoY, of which 94.64% constituted processing trade with imported materials.
On the import front, cumulative imports of refined silver from January to May were 815 mt, compared to net imports of just 16 mt in the same period last year. The sharp import growth was mainly driven by an expanding price spread between domestic and overseas markets. With China’s silver ingot premiums remaining elevated, speculative purchases of overseas silver ingots increased significantly in the Shenzhen area, and silver ingots briefly transitioned into a rare net import mode in March. Some smelters could still achieve significant profits by exporting through processing trade with imported materials and then re-importing through ordinary trade. After April, the import window gradually closed, and refined silver import and export trade returned to its normal pattern. Exports are expected to remain stable in H2, while imports will return to normalized levels barring major disruptions to the price spread between Chinese and overseas markets.
In May 2026, India raised the basic customs duty on gold and silver imports from 5% to 10%. India’s banking industry proactively paid duties to resume gold and silver imports, completing the customs clearance of 9 mt of gold and 34 mt of silver in May. As a major demand market for global silver jewelry and electronic components manufacturing, India’s import duty hike in H2 may suppress its purchasing demand, potentially having some impact on the export market.
Demand Side: Solar Cell Silver Demand Down 21% YoY, Industrial Demand Replaces Investment as the Main Theme
In H1 2026, solar cell production experienced a significant decline in Q1 and a gradual recovery in Q2. Q1 production fell 22% QoQ, mainly affected by multiple factors: suppressed purchasing appetite due to high silver prices (silver accounts for approximately 30%-40% of solar cell costs), the traditional production off-season, and the anticipated cancellation of the PV module export tax rebate policy in April. Some enterprises experienced a temporary rebound in April due to an export rush. Entering Q2, ample centralized PV module orders, coupled with India’s ALMM policy officially taking effect on June 1, prompted enterprises to front-load exports before the policy window closed, continuously boosting production schedules. Q2 production showed a monthly uptrend, edging up slowly.
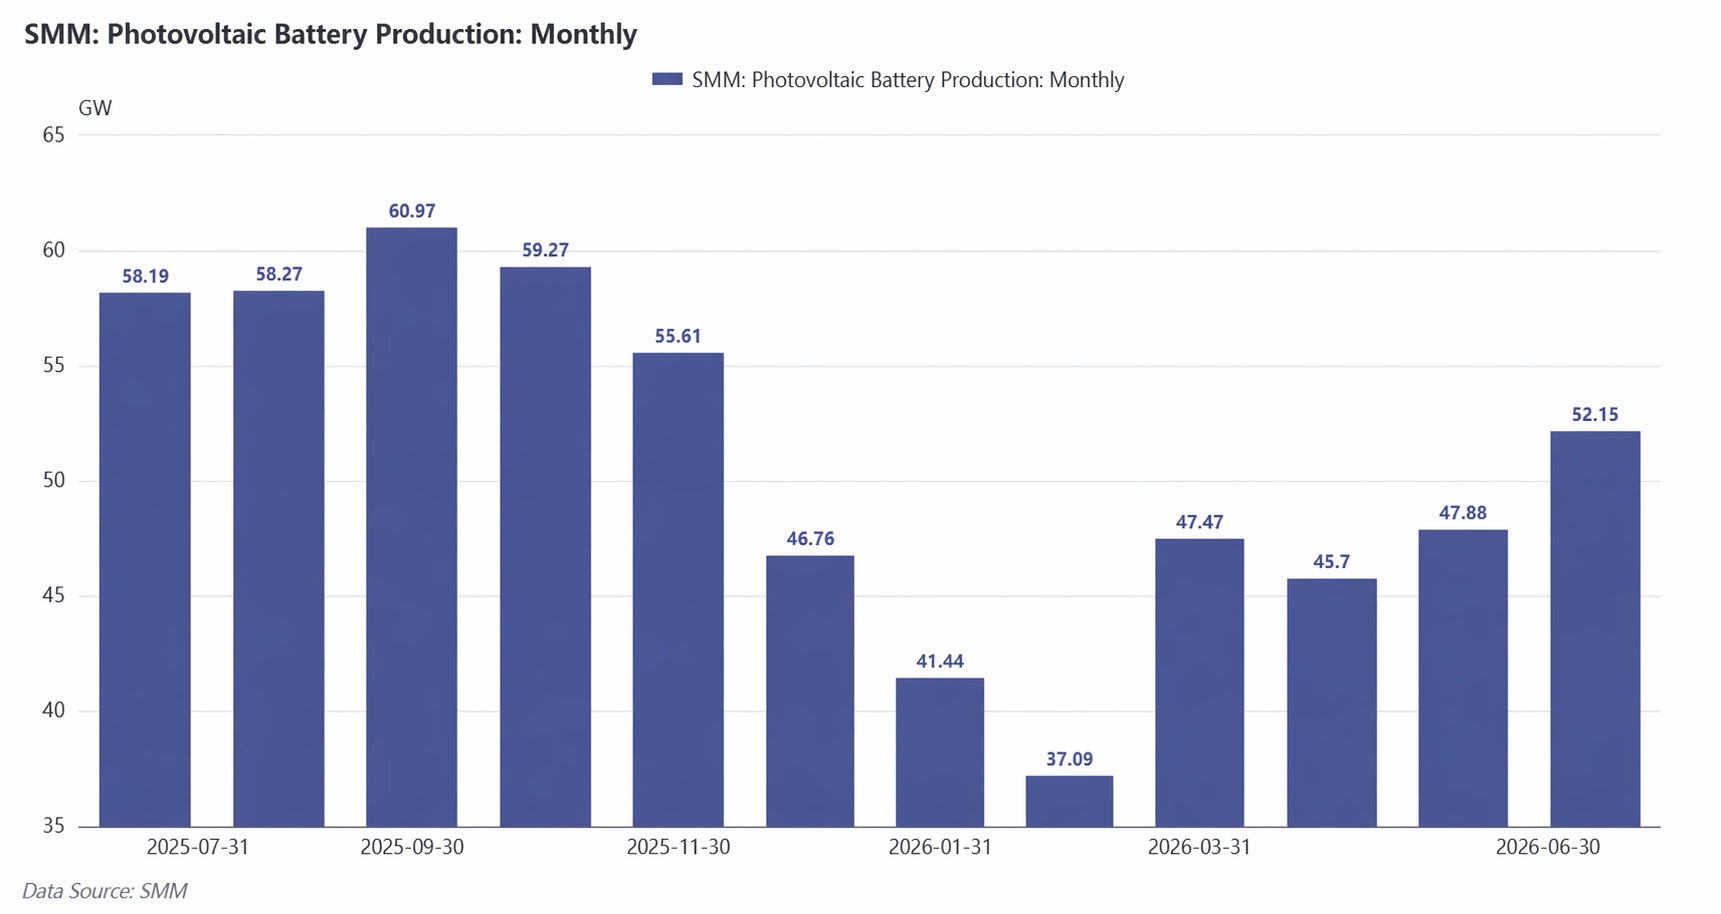
From the perspective of total silver usage in solar cells, the progress of substituting copper for silver remained average. According to SMM data, average silver consumption per GW of solar cells in 2026 is expected to be 9 mt, down 5% YoY, with an annual decline rate roughly maintained at around 5% from then until 2030. However, due to falling end-user module production, annual solar cell output is expected to be revised downward. Solar cell silver usage in 2026 is approximately 4,935 mt, down 21% YoY.
Looking at the overall demand structure for 2026, silver demand from solar cells shrank significantly, while investment demand became dominant in Q1. Industrial demand remained rigid, boosted by SiC chips, PCB circuit boards, and the NEV market. However, judging from Q2 premiums performance, the market has returned from the previously overheated investment demand phase to the main theme of industrial demand. Combined with reduced demand from the PV sector, overall demand was sluggish. Affected by the traditional off-season in July and August, industrial demand support will be insufficient. Starting from September-October, industrial demand is expected to recover gradually, and the narrative of silver consumption driven by AI development is expected to materialize step by step.
Market Outlook
Overall, the silver market in H1 2026 was essentially a valuation rebalancing after liquidity expectations receded, with extreme anomalies on the spot side further amplifying market volatility amplitude. The loose monetary expectations at the beginning of the year front-loaded the valuation room, while the spot market squeeze pushed prices to an extreme high that deviated from fundamentals. Subsequently, interest rate cut expectations completely reversed, and the high-interest-rate environment persistently suppressed the monetary attributes of precious metals, serving as the core driver for the downward trend throughout H1.
For the H2 outlook, US inflation data inflection signals in Q3 and marginal changes in the US Fed’s policy tone remain the core macro observation windows. The trajectory of the US dollar index and US Treasury real yields will directly determine the rhythm and room for silver’s valuation recovery. Before a clear turning point emerges in the macro headwinds, silver is expected to overall maintain a fluctuating and subdued pattern. Meanwhile, fundamental variables such as the spot supply-demand pattern could also be monitored, as they may become important triggers for periodic rebound rallies.
Source: Original Article