




Friday, July 10, 2026
No Result
View All Result
  • Home
  • Market Overview
    • All
    • Crude Oil Prices
    • Cryptocurrency News
    • Economy News
    • ETFs
    • Foreign Exchange News
    • Indices
    • Stock Market

    Does LPL Financial (LPLA) Joining Russell Value Indices Alter Its Advisor-Led Growth Narrative?

    U.S. stocks and crude oil prices drift to a quiet finish of a bumpy week

    AI Agent Security Boosts Okta Shares

    Hyundai adopts stablecoins for cross-border treasury transfers

    Inflation Concerns and Rising Crude Oil Prices Mean You Should Sell U.S. T-Bonds Here

    SnapShot 266

    • Crude Oil Prices
    • Cryptocurrency News
    • Economy News
    • ETFs
    • Indices
    • Stock Market
    • Foreign Exchange News
    • Commodities News
  • Forex Market
    • All
    • Central Banks News
    • Currencies
    • Interest Rate
    • Nonfarm Payroll

    German Stocks Slip As Oil Tests Central Banks’ Nerves

    SoS! The overnight bilateral liquidity provision of non-bank financial institutions to banks

    GBP/JPY Price Forecast: Bulls remain in control with RSI and MACD in positive territory

    Czech Price Pressures Warrant Increased Caution for Central Bank

    Bank of England Warns of Escalating AI, Cyber & Market Risk

    FF News

    Lower oil prices reduce the pressure on central banks

    British Pound retreats from multi-year highs as JPY strengthens

    Polish rate-setter Wnorowski says talk of Sept rate cut premature

    • Central Banks News
    • Currencies
    • Interest Rate
    • Nonfarm Payroll
  • Commodities
    • All
    • Gold
    • Oil and Gas
    • Silver

    Crude Oil Prices Slide as President Trump Said Iran Peace Talks to Continue

    UBS Adjusts Price Target on Magnolia Oil & Gas to $34 From $38, Maintains Buy Rating

    US stocks and crude oil prices drift to a quiet finish of a bumpy week

    Gold Price Today on July 10, 2026

    Gold prices today, Friday, July 10, 2026: Gold finally opens higher this morning

    Gold price forecasts lowered to $4,560 for 2026 as stronger dollar, Fed policy pressure markets

    • Gold
    • Oil and Gas
    • Silver
  • Crypto
    • All
    • Bitcoin
    • Ethereum
    • Litecoin
    • Ripple
    • Solana
    • XRP

    Ethereum Price Analysis: ETH Faces a Crucial Test After Latest Rebound

    Metaplanet Announces Joint Study To Bring Bitcoin-Backed Digital Credit To Japan

    Ethereum must move faster or risk losing its edge says Starkware Founder

    ZachXBT Says Early Solana Whale Was Hacked, 180,900 SOL Stolen

    Solana reaches Mainnet Epoch 1000 milestone

    Ethereum Foundation Disbands Protocol Support Team in Latest Restructuring

    • Bitcoin
    • Ethereum
    • Litecoin
    • Ripple
    • Solana
    • XRP
  • Charts
  • Economic Calendar
No Result
View All Result
Home Forex Market Currencies

GBP/JPY Price Forecast: Bulls remain in control with RSI and MACD in positive territory

by MarketNewsBoard
4 hours ago
in Currencies, Forex Market
Share on FacebookShare on Twitter

GBP/JPY trades under pressure on Friday after comments from Japan’s Finance Minister Satsuki Katayama boosted the Japanese Yen (JPY). At the time of writing, the cross is trading around 217.10, down 0.30% on the day.

Katayama said the government would encourage domestic pension funds, including the Government Pension Investment Fund (GPIF), to increase their holdings of Japanese financial assets.

However, the remarks did little to reverse the Yen’s broad-based weakness, leaving GBP/JPY pinned near levels last seen in 2008 and on track for a third consecutive weekly gain.

Meanwhile, the British Pound (GBP) remains the strongest-performing G10 currency in recent weeks, supported by Bank of England (BoE) interest rate hike bets and easing political uncertainty in the United Kingdom.
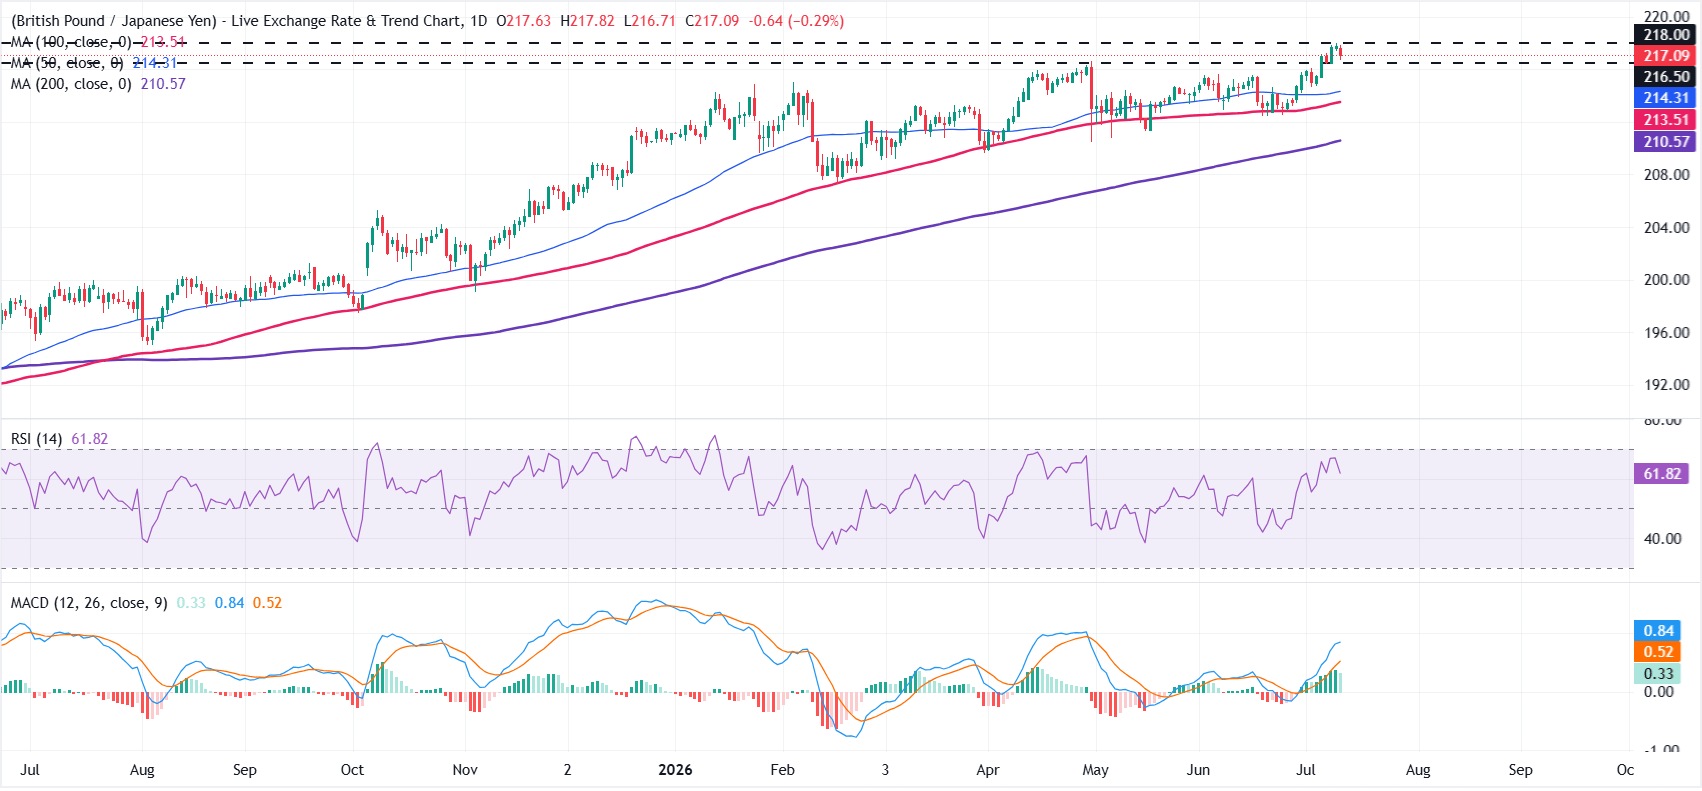
From a technical perspective, GBP/JPY maintains a bullish bias on the daily chart, holding above the 50-day, 100-day and 200-day Simple Moving Averages (SMAs), reinforcing the broader uptrend.

The cross also remains above the horizontal support at 216.50, while the Relative Strength Index (RSI) stands at 62.54, remaining in bullish territory. Meanwhile, the Moving Average Convergence Divergence (MACD) indicator stays in positive territory at 0.33, suggesting upside momentum remains constructive.

On the upside, immediate resistance is located at the 218.00 horizontal barrier. A sustained break above this level could pave the way for an extension of the broader uptrend.

Initial support is seen at 216.50, followed by the 50-day SMA at 214.31 and the 100-day SMA at 213.51. The 200-day SMA at 210.57 provides the next major support if a deeper corrective pullback unfolds.

US Dollar Price Today

The table below shows the percentage change of US Dollar (USD) against listed major currencies today. US Dollar was the strongest against the Swiss Franc.

USD EUR GBP JPY CAD AUD NZD CHF
USD 0.03% -0.07% -0.36% -0.15% -0.09% -0.20% 0.05%
EUR -0.03% -0.11% -0.39% -0.18% -0.13% -0.26% 0.02%
GBP 0.07% 0.11% -0.28% -0.07% -0.03% -0.15% 0.11%
JPY 0.36% 0.39% 0.28% 0.21% 0.27% 0.11% 0.39%
CAD 0.15% 0.18% 0.07% -0.21% 0.05% -0.09% 0.18%
AUD 0.09% 0.13% 0.03% -0.27% -0.05% -0.13% 0.11%
NZD 0.20% 0.26% 0.15% -0.11% 0.09% 0.13% 0.26%
CHF -0.05% -0.02% -0.11% -0.39% -0.18% -0.11% -0.26%

The heat map shows percentage changes of major currencies against each other. The base currency is picked from the left column, while the quote currency is picked from the top row. For example, if you pick the US Dollar from the left column and move along the horizontal line to the Japanese Yen, the percentage change displayed in the box will represent USD (base)/JPY (quote).

Source: Original Article

Previous Post

Czech Price Pressures Warrant Increased Caution for Central Bank

Next Post

US Indices Forecast: Bullish Momentum Targets Record Breakouts

RelatedPosts

German Stocks Slip As Oil Tests Central Banks’ Nerves

by MarketNewsBoard
1 hour ago

With crude moving from just above $70 to just below $80, Bank of America says the risk balance tilts slightly toward an ECB hike in...

Read moreDetails

SoS! The overnight bilateral liquidity provision of non-bank financial institutions to banks

by MarketNewsBoard
3 hours ago

Staff Working Paper No. 1,195 Elio Cucullo, Andrew Clare and Angela Gallo We study the overnight bilateral gilt repo market to assess how global non-bank...

Read moreDetails
Next Post

US Indices Forecast: Bullish Momentum Targets Record Breakouts

XRP's Exchange Supply Just Hit a 7-Year Low. So Why Isn't the Price Moving?

Recommended.

XRP Price Holds $1.09: Can Buyers Crack $1.20 Before the CLARITY Act Vote?

July 9, 2026

EUR/USD in a Narrow Range: Focus on Fed Minutes

July 6, 2026

Trending.

No Content Available
Market News Board | Market Analysis,Charts & News

MarketNewsBoard delivers trusted financial news, real-time market analysis, interactive charts, and economic insights across the global financial markets.

Covering Forex, Commodities, Stocks, Indices, Cryptocurrencies, and major economic events...

Follow Us

Market Overview

  • Forex Market
  • Commodities
  • Cryptocurrency News
  • Stocks
  • Indices
  • Crude Oil Prices
  • Economic Calendar

Resources

  • Central Banks News
  • Economy News
  • Interest Rate
  • Nonfarm Payroll
  • Charts

Tools

  • Currency Heat Map
  • Correlation Matrix
  • Market Sentiment
  • Currency Cross Rates
  • Crypto Rates
  • About Us
  • Contact Us
  • Disclaimer
  • Privacy Policy
  • Terms and Conditions

© 2026 MarketNewsBoard | Market Analysis, Charts & News.

AAPL
$314.66
AMZN
$246.09
BTC-USD
$63,993.16
EURUSD=X
$1.14
DX-Y.NYB
$100.78
NVDA
$209.56
TSLA
$412.45
DOW
$28.90
^N225
$68,557.73
JPY=X
$161.47
GBPUSD=X
$1.34
CAD=X
$1.41
NG=F
$2.92
BZ=F
$75.56
NFLX
$73.03
GOOG
$353.06
MSFT
$385.63
^RUT
$2,973.27
^FTSE
$10,497.29
AUDUSD=X
$0.696
CHF=X
$0.807
HG=F
$6.29
ETH=F
$1,796.00
No Result
View All Result
  • Home

© 2026 MarketNewsBoard | Market Analysis, Charts & News.