
















Thursday, August 27, 2026
No Result
View All Result
  • Home
  • Market Overview
    • All
    • Crude Oil Prices
    • Cryptocurrency News
    • Economy News
    • ETFs
    • Foreign Exchange News
    • Indices
    • Stock Market

    UN Food Security Report Finds $540BN in Farm Subsidies Locked Into Commodities That Crowd Out Plant Foods – vegconomist

    AEGIS Hedging to Be Acquired by Private Equity at Goldman Sachs Alternatives

    Glencore plans large LME lead withdrawals after stocks surge, sources say

    AI Turns Competence into a Commodity: Evidence from 2.26 Million Freelance Contracts

    JPMAM adds commodities to lagging multi-asset strats

    New Houthi maritime strikes keep European gas futures pinned near multi-month peak

    • Crude Oil Prices
    • Cryptocurrency News
    • Economy News
    • ETFs
    • Indices
    • Stock Market
    • Foreign Exchange News
    • Commodities News
  • Forex Market
    • All
    • Central Banks News
    • Currencies
    • Interest Rate
    • Nonfarm Payroll

    Nonfarm employment declined by 23,000 in July, with the unemployment rate rising to 4.1 percent, signaling a slowdown in the job market

    Peso may rebound after weak US payrolls report

    Gold Price Forecast: Cooling Fed Rate Hike Expectations Boost Appeal as Price May Hit $4,500?

    Forex Today: Market Focus Shifts from Middle East to US Nonfarm Payrolls

    Summertime job market remains muggy

    US labor market shows signs of weakness! July nonfarm payrolls unexpectedly decrease by 23,000; May and June data revised down sharply. Fed rate hike expectations cool down.

    Nonfarm payrolls down in July; unemployment rate eases to 4.1%

    US payrolls fall 23,000 in July in shock report; May, June figures sharply revised down

    US nonfarm payrolls unexpectedly decline in July; unemployment rate eases to 4.1%

    • Central Banks News
    • Currencies
    • Interest Rate
    • Nonfarm Payroll
  • Commodities
    • All
    • Gold
    • Oil and Gas
    • Silver

    Silver Outlook: VC PMI and Cycle Date Analysis Point to Next Bullish Opportunity

    Silver analysis today

    Gold and Silver Market Correction 2026: Is the Bull Market Over?

    Silver Tracking Industrial Demand as Manufacturing and Inflation Shape Markets

    Silver VC PMI Outlook: Buy-Level Support Targets $61.51 Weekly Resistance

    Silver Tests Critical VC PMI Demand Zone as Cycle Window Hints Potential Reversal

    • Gold
    • Oil and Gas
    • Silver
  • Crypto
    • All
    • Bitcoin
    • Ethereum
    • Litecoin
    • Ripple
    • Solana
    • XRP

    Litecoin Price Prediction: Is LTC Heading Toward $40 After Trendline Breakdown?

    Ripple Launches Ripple Mint for Institutional RLUSD Access

    Litecoin Approaches Descending Channel Breakout as Technical Momentum Builds

    Ripple Launches Institutional Mint Platform for RLUSD Amid Transfer Volume Drop

    The ripple effects of farming injuries

    Litecoin Price Risks Drop to $35 if $43 Support Breaks

    • Bitcoin
    • Ethereum
    • Litecoin
    • Ripple
    • Solana
    • XRP
  • Charts
  • Economic Calendar
  • FX Analysis
    • EUR/USD
    • GBP/USD
No Result
View All Result
Home Crypto
2 months ago

XRP News: Weekly RSI Went Oversold Only Twice in 12 Years

XRP Price has triggered one of its rarest technical signals, sparking fresh speculation about a potential price rally. The token’s weekly Relative Strength Index (RSI) has dropped below 30 for only the second time in its 12-year history. 

The last time this happened, XRP went on to gain more than 1,100%. While past performance does not guarantee the same outcome, many traders are now watching closely to see if XRP could be preparing for another major move.

XRP Weekly RSI Drops Below 30 for Only the Second Time

Entrepreneur and popular crypto trader Lark Davis pointed out that XRP’s weekly RSI has fallen into oversold territory only twice since the token launched.

“In 12 years, XRP has hit oversold on the weekly RSI. Two times. Not five times, not three times—just two times in 12 years.”

Add Coinpedia as a trusted source in Google NewsAdd Coinpedia as a trusted source in Google News

According to Davis, the first time it happened was during the 2022 bear market, when XRP’s weekly RSI dropped to 28.09 after heavy selling pushed the price from $0.8519 to a June 2022 low of $0.2905.

The second time came in last month in June 2026, when the weekly RSI fell to 29.6, marking another historic low. At that time, the XRP price fell from a high of $1.34 to a low of $1.020.

Since this signal has appeared only twice in XRP’s history, many traders are treating it as an important development.

What Happened the Last Time XRP Became Oversold?

The previous oversold signal in 2022 marked a major turning point for XRP.

After falling below $0.30, the token gradually recovered before entering a strong bull market. By July 2025, XRP had climbed above $3.66, delivering gains of more than 1,100% from its lows.

This historical move has drawn attention to the latest RSI signal. However, Davis warned that the indicator should not be viewed as a guarantee of another rally.

“That doesn’t guarantee the same outcome this time. There are no guarantees in markets. But when a signal this rare appears on an asset with this much institutional attention and retail participation, I think it deserves attention.”

In other words, the RSI suggests that selling pressure may be fading, but investors should still look for confirmation from price action before expecting a sustained recovery.

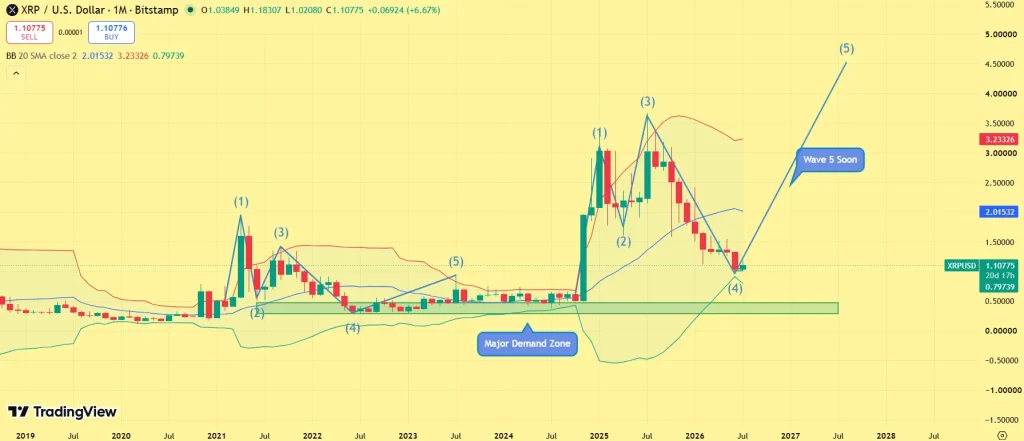
XRP Price Analysis: Is a Move Toward $4.50 Possible?

The monthly XRP chart suggests that selling pressure may be easing.

According to Coinpedia’s analysis, XRP may have completed the fourth phase of its correction and could now be preparing for another upward move.
XRP monthly price chartXRP monthly price chart

At the time of writing, XRP is trading near $1.10, while the lower Bollinger Band sits around $0.80. Meanwhile, the monthly RSI has recovered to around 47, bouncing back from oversold levels. This indicates that buying interest is slowly returning.

However, a key challenge remains. XRP must break above and hold the 20-month moving average near $2.01 before a long-term bullish trend can be confirmed.

In the short term, the first major resistance lies between $1.18 and $1.20, where sellers could become active again.

Will XRP Repeat Its Previous Bull Run?

The weekly RSI falling below 30 is one of the rarest signals in XRP’s trading history, having occurred only twice in the past 12 years. The previous signal was followed by a massive rally, but there is no guarantee that history will repeat itself.

Still, improving momentum, recovering RSI levels, and growing market interest have made XRP one of the cryptocurrencies traders are watching closely. If buyers can push the price above key resistance levels, XRP could build the momentum needed for a stronger recovery and potentially challenge new highs in the months ahead.

Was this writing helpful?

Tell us why!

Share this insight with your network!

Story Ends Here

Trust with CoinPedia:

CoinPedia has been delivering accurate and timely cryptocurrency and blockchain updates since 2017. All content is created by our expert panel of analysts and journalists, following strict Editorial Guidelines based on E-E-A-T (Experience, Expertise, Authoritativeness, Trustworthiness). Every article is fact-checked against reputable sources to ensure accuracy, transparency, and reliability. Our review policy guarantees unbiased evaluations when recommending exchanges, platforms, or tools. We strive to provide timely updates about everything crypto & blockchain, right from startups to industry majors.

Investment Disclaimer:

All opinions and insights shared represent the author’s own views on current market conditions. Please do your own research before making investment decisions. Neither the writer nor the publication assumes responsibility for your financial choices.

Sponsored and Advertisements:

Sponsored content and affiliate links may appear on our site. Advertisements are marked clearly, and our editorial content remains entirely independent from our ad partners.

Read the Next News

Source: Original Article

RelatedPosts

Crypto

Litecoin Price Prediction: Is LTC Heading Toward $40 After Trendline Breakdown?

July 25, 2026
Crypto

Ripple Launches Ripple Mint for Institutional RLUSD Access

July 25, 2026
Crypto

Litecoin Approaches Descending Channel Breakout as Technical Momentum Builds

July 24, 2026
Forex Market

Summertime job market remains muggy

August 7, 2026
Forex Market

US labor market shows signs of weakness! July nonfarm payrolls unexpectedly decrease by 23,000; May and June data revised down sharply. Fed rate hike expectations cool down.

August 7, 2026
Forex Market

Nonfarm payrolls down in July; unemployment rate eases to 4.1%

August 7, 2026
Forex Market

US payrolls fall 23,000 in July in shock report; May, June figures sharply revised down

August 7, 2026
Next Post

NSE Indices launches Nifty500 Ahimsa Index: From 'ethical' filters to screening, how the benchmark works

Fuel prices to remain unchanged in Taiwan next week

Gold Pullback: Why The Long-Term Investment Case Remains Intact

Market News Board | Market Analysis,Charts & News

MarketNewsBoard delivers trusted financial news, real-time market analysis, interactive charts, and economic insights across the global financial markets.

Covering Forex, Commodities, Stocks, Indices, Cryptocurrencies, and major economic events...

Market Overview

  • Forex Market
  • Commodities
  • Cryptocurrency News
  • Stocks
  • Indices
  • Crude Oil Prices
  • Economic Calendar

Resources

  • Central Banks News
  • Economy News
  • Interest Rate
  • Nonfarm Payroll
  • Charts

Tools

  • Currency Heat Map
  • Correlation Matrix
  • Market Sentiment
  • Currency Cross Rates
  • Crypto Rates
  • About Us
  • Contact Us
  • Disclaimer
  • Privacy Policy
  • Terms and Conditions

© 2026 MarketNewsBoard | Market Analysis, Charts & News.

AAPL
$313.45
AMZN
$260.28
BTC-USD
$78,654.90
EURUSD=X
$1.17
DX-Y.NYB
$99.15
NVDA
$209.66
TSLA
$345.82
DOW
$30.33
^N225
$66,045.18
JPY=X
$159.33
GBPUSD=X
$1.36
CAD=X
$1.39
NG=F
$2.93
BZ=F
$86.11
NFLX
$81.46
GOOG
$339.10
MSFT
$496.37
^RUT
$3,005.90
^FTSE
$10,878.12
AUDUSD=X
$0.719
CHF=X
$0.806
HG=F
$6.70
ETH=F
$2,489.00
No Result
View All Result
  • Home

© 2026 MarketNewsBoard | Market Analysis, Charts & News.