
















Thursday, August 27, 2026
No Result
View All Result
  • Home
  • Market Overview
    • All
    • Crude Oil Prices
    • Cryptocurrency News
    • Economy News
    • ETFs
    • Foreign Exchange News
    • Indices
    • Stock Market

    UN Food Security Report Finds $540BN in Farm Subsidies Locked Into Commodities That Crowd Out Plant Foods – vegconomist

    AEGIS Hedging to Be Acquired by Private Equity at Goldman Sachs Alternatives

    Glencore plans large LME lead withdrawals after stocks surge, sources say

    AI Turns Competence into a Commodity: Evidence from 2.26 Million Freelance Contracts

    JPMAM adds commodities to lagging multi-asset strats

    New Houthi maritime strikes keep European gas futures pinned near multi-month peak

    • Crude Oil Prices
    • Cryptocurrency News
    • Economy News
    • ETFs
    • Indices
    • Stock Market
    • Foreign Exchange News
    • Commodities News
  • Forex Market
    • All
    • Central Banks News
    • Currencies
    • Interest Rate
    • Nonfarm Payroll

    Nonfarm employment declined by 23,000 in July, with the unemployment rate rising to 4.1 percent, signaling a slowdown in the job market

    Peso may rebound after weak US payrolls report

    Gold Price Forecast: Cooling Fed Rate Hike Expectations Boost Appeal as Price May Hit $4,500?

    Forex Today: Market Focus Shifts from Middle East to US Nonfarm Payrolls

    Summertime job market remains muggy

    US labor market shows signs of weakness! July nonfarm payrolls unexpectedly decrease by 23,000; May and June data revised down sharply. Fed rate hike expectations cool down.

    Nonfarm payrolls down in July; unemployment rate eases to 4.1%

    US payrolls fall 23,000 in July in shock report; May, June figures sharply revised down

    US nonfarm payrolls unexpectedly decline in July; unemployment rate eases to 4.1%

    • Central Banks News
    • Currencies
    • Interest Rate
    • Nonfarm Payroll
  • Commodities
    • All
    • Gold
    • Oil and Gas
    • Silver

    Silver Outlook: VC PMI and Cycle Date Analysis Point to Next Bullish Opportunity

    Silver analysis today

    Gold and Silver Market Correction 2026: Is the Bull Market Over?

    Silver Tracking Industrial Demand as Manufacturing and Inflation Shape Markets

    Silver VC PMI Outlook: Buy-Level Support Targets $61.51 Weekly Resistance

    Silver Tests Critical VC PMI Demand Zone as Cycle Window Hints Potential Reversal

    • Gold
    • Oil and Gas
    • Silver
  • Crypto
    • All
    • Bitcoin
    • Ethereum
    • Litecoin
    • Ripple
    • Solana
    • XRP

    Litecoin Price Prediction: Is LTC Heading Toward $40 After Trendline Breakdown?

    Ripple Launches Ripple Mint for Institutional RLUSD Access

    Litecoin Approaches Descending Channel Breakout as Technical Momentum Builds

    Ripple Launches Institutional Mint Platform for RLUSD Amid Transfer Volume Drop

    The ripple effects of farming injuries

    Litecoin Price Risks Drop to $35 if $43 Support Breaks

    • Bitcoin
    • Ethereum
    • Litecoin
    • Ripple
    • Solana
    • XRP
  • Charts
  • Economic Calendar
  • FX Analysis
    • EUR/USD
    • GBP/USD
No Result
View All Result
Home Crypto
2 months ago

Ethereum Price Analysis: ETH Reaches Its Biggest Obstacle on the Road to $2K

Ethereum has continued its recovery from the June lows and is now approaching a major technical inflection point. While the recent rally has improved short-term sentiment, the asset is still trading beneath a confluence of long-term resistance levels.

Interestingly, the liquidation landscape aligns closely with these technical barriers, suggesting that ETH could first target overhead liquidity before the market decides whether a larger trend reversal is underway or another corrective leg lower remains ahead.

Ethereum Price Analysis: The Daily Chart

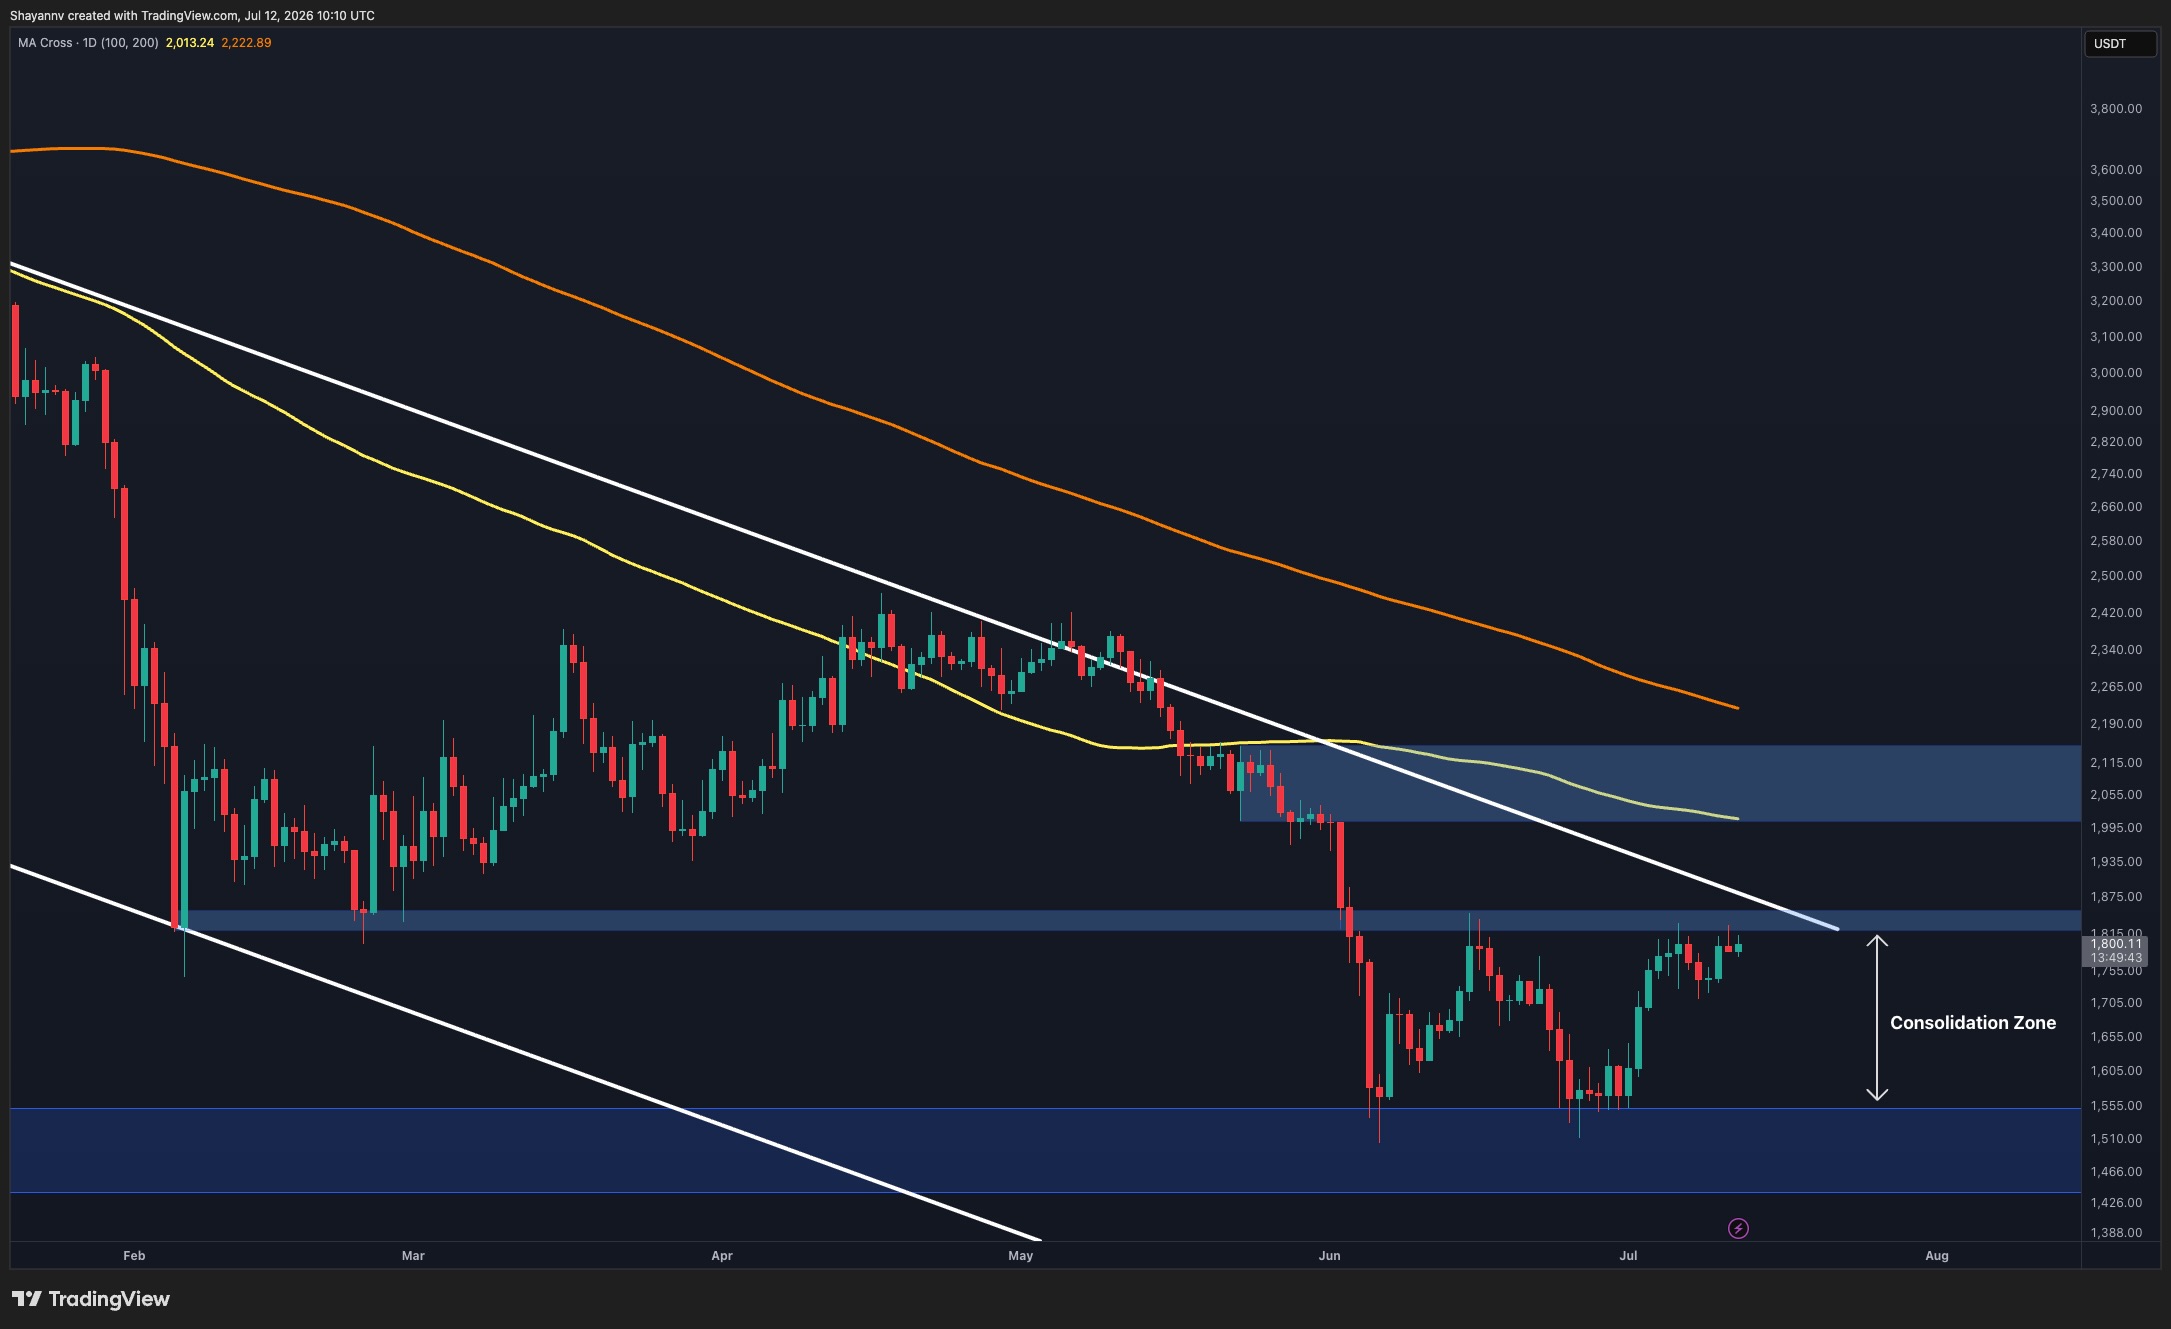
On the daily timeframe, ETH remains within a broader descending structure in place since the beginning of the year. It has recovered strongly from the major demand zone around $1.45K-$1.55K and is currently testing the key resistance region around $1.80K-$1.85K.

This area is particularly significant because it coincides with the descending trendline that has capped price action since May. The level also represents a major horizontal resistance that previously acted as support before the June breakdown.

Despite the recent strength, ETH remains below the 100-day and 200-day moving averages, both of which continue to trend lower. The 100-day MA is positioned around the $2K-$2.1K resistance zone, while the 200-day MA remains considerably higher near $2.2K, reinforcing the broader bearish market structure.

As long as ETH remains below the descending trendline and the $1.80K-$1.85K resistance zone, the current move can still be viewed as a recovery rally within a larger downtrend. A decisive breakout above this area would shift focus toward the next major resistance at $2K-$2.1K.
ETH/USDT 4-Hour Chart

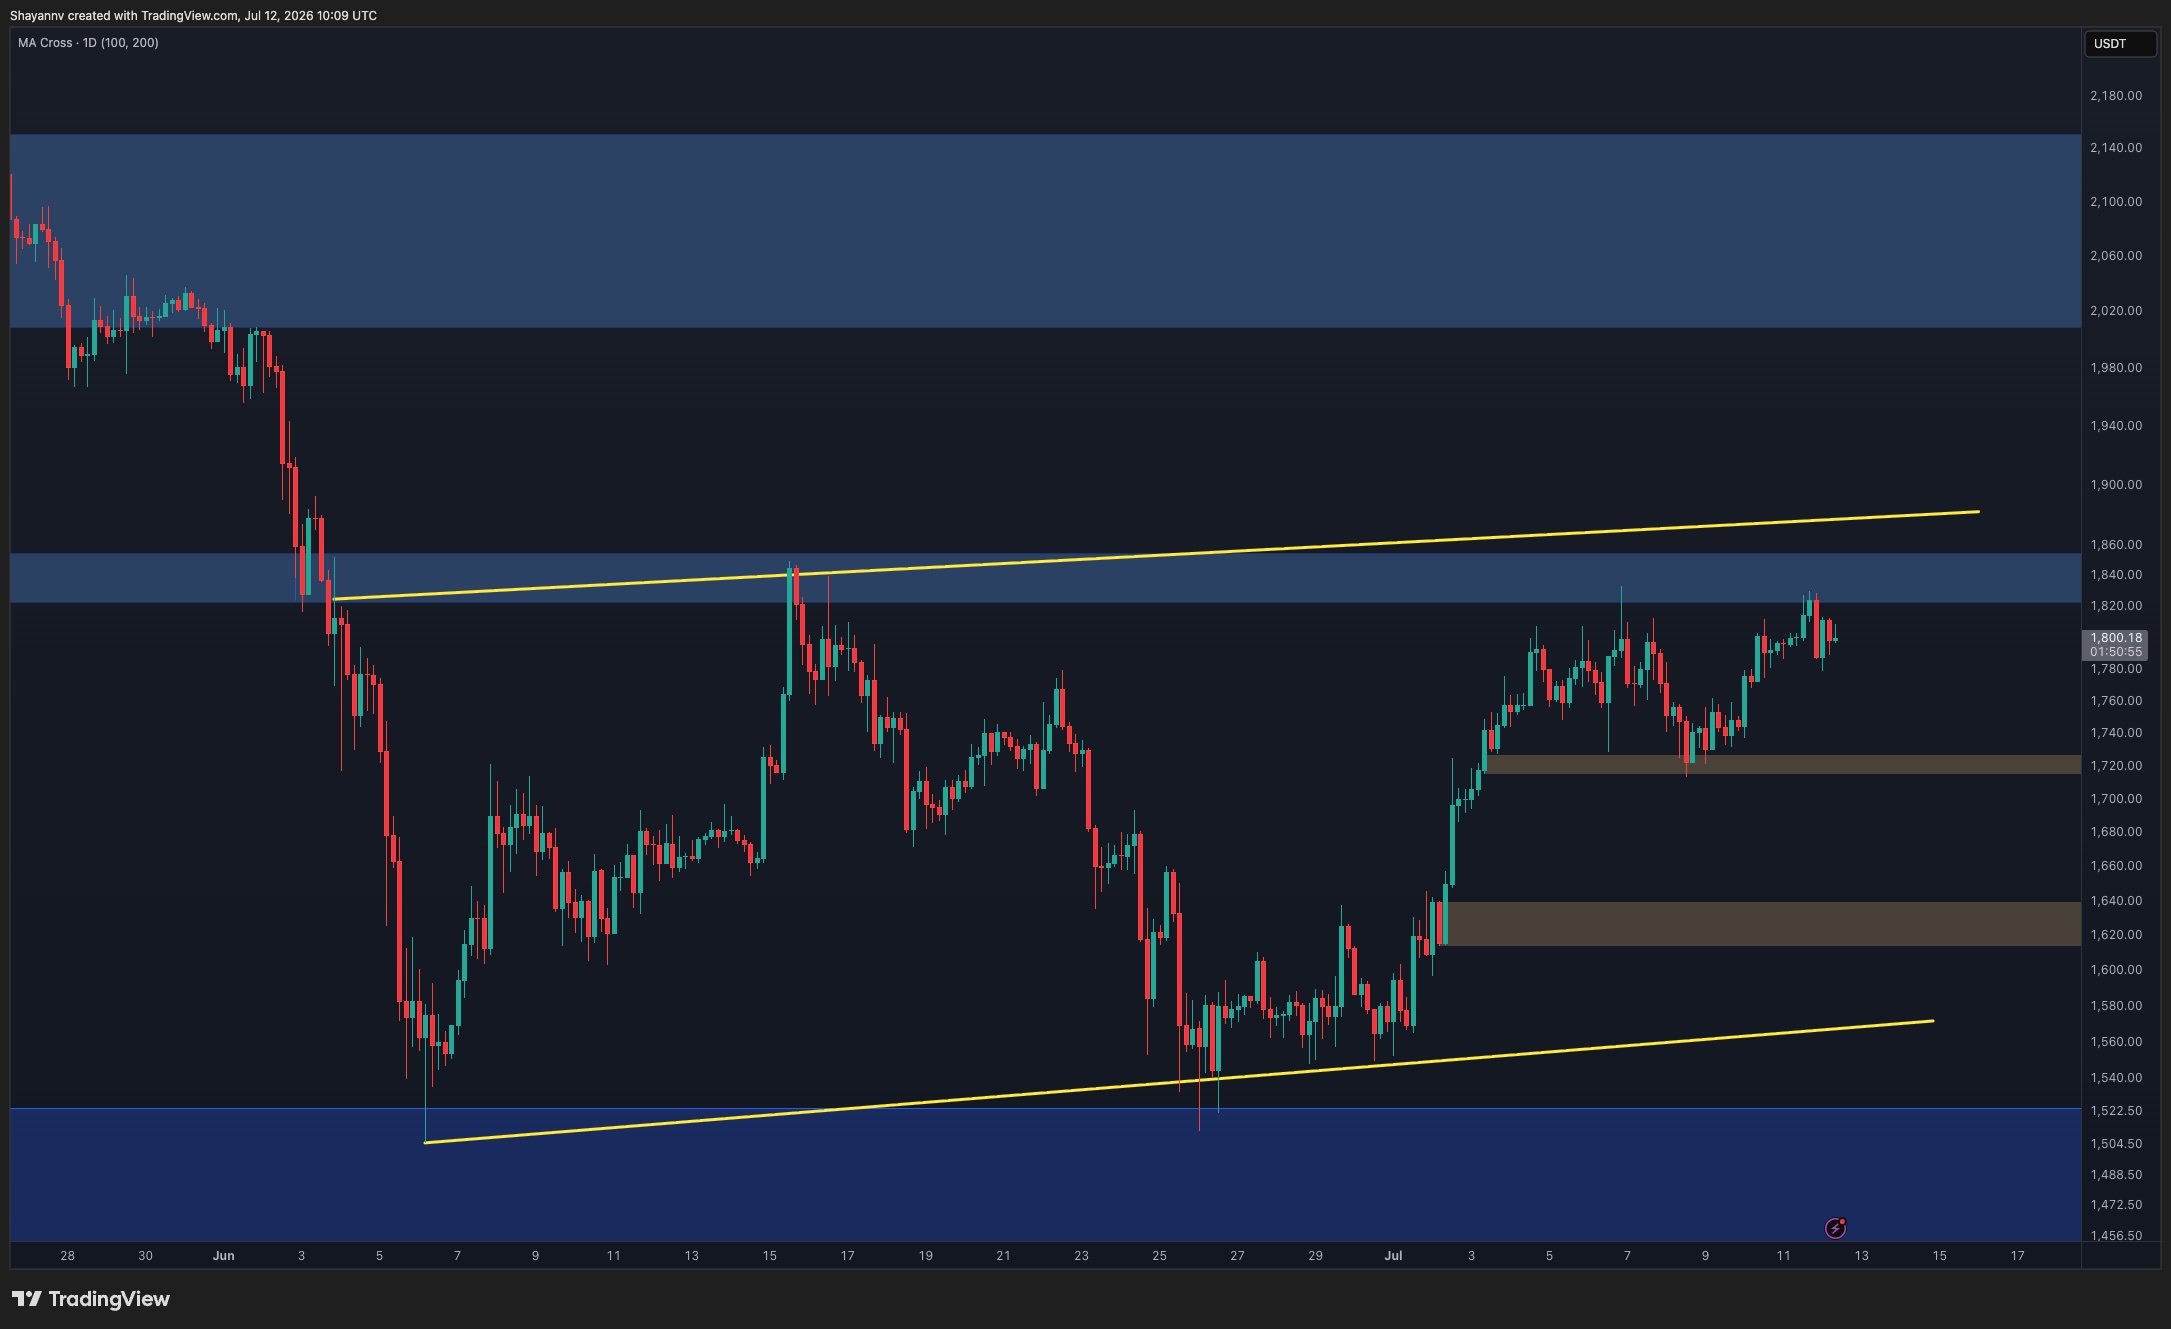
The 4-hour chart highlights a clear ascending structure that has developed since the late-June low. Price has respected the rising channel boundaries while forming higher highs and higher lows, reflecting improving short-term momentum.

The market has already reclaimed the $1.62K-$1.64K demand zone and subsequently established another support area around $1.72K-$1.74K. These zones have repeatedly attracted buyers during pullbacks and continue to define the short-term bullish structure.

However, the rally is now approaching the upper boundary of the channel and the major resistance band around $1.83K-$1.85K. This creates a natural area where profit-taking and seller activity could emerge.

From a structural perspective, ETH remains constructive above the $1.72K-$1.74K support region. Losing this level would be the first sign that bullish momentum is fading and could expose the lower channel boundary and the broader support zone around $1.55K.
Sentiment Analysis

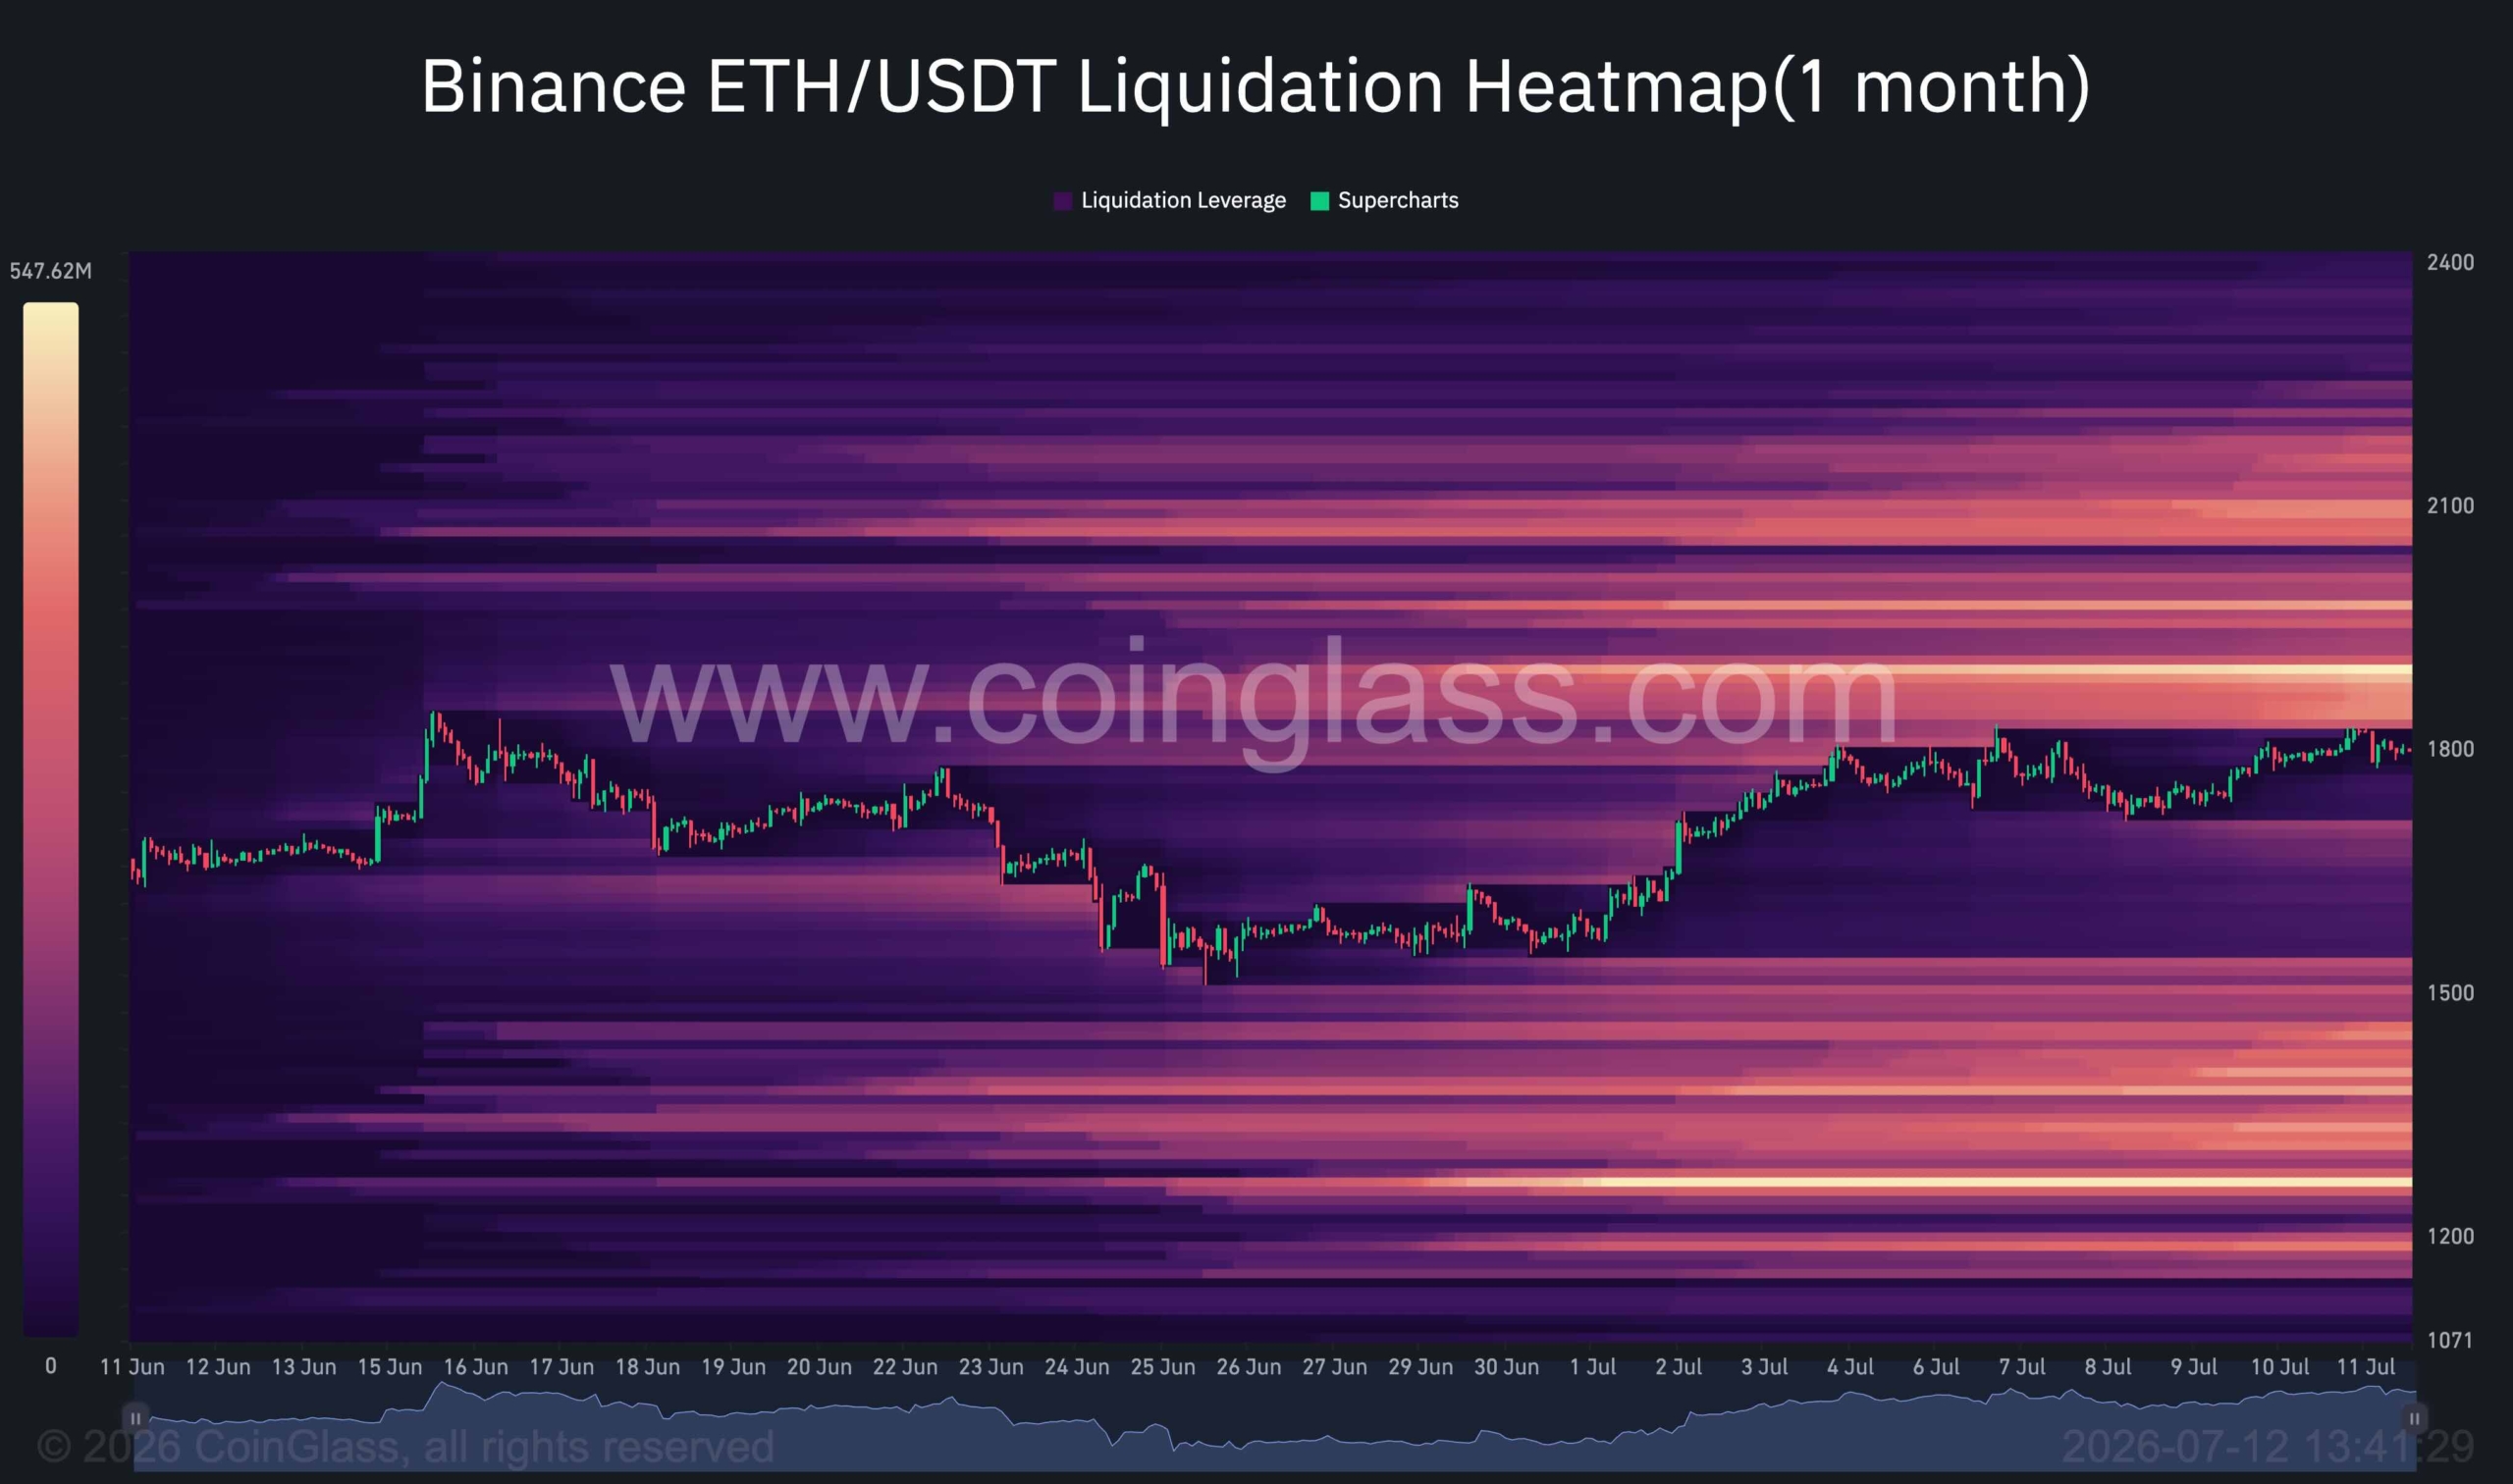
The Binance ETH/USDT liquidation heatmap provides an important clue regarding the next likely move.

The most significant concentration of short-side liquidity sits above the current market price, particularly within the $1.95K-$2.1K region. This cluster aligns remarkably well with the daily chart resistance zone, the 100-day moving average, and the broader supply area visible on the higher timeframe.

Meanwhile, substantial liquidity pools remain below the market around the $1.45K-$1.55K region, which corresponds closely with the major daily demand zone that has supported ETH throughout the recent recovery.

The alignment between the liquidation map and the technical structure suggests that the market may first be drawn toward the overhead liquidity cluster. A move into the $2K-$2.1K area would effectively sweep a large concentration of short liquidations while simultaneously testing one of the most important resistance zones on the chart.

The reaction at that region will likely determine the next major directional move. If buyers manage to reclaim the $2K-$2.1K resistance area and establish acceptance above it, the recovery could evolve into a broader bullish trend reversal. However, if the liquidity sweep is followed by strong selling pressure and rejection from resistance, ETH could enter another notable decline, potentially targeting the large liquidity pools resting beneath the market around the $1.45K-$1.55K support zone.
SPECIAL OFFER (Exclusive)

LIMITED OFFER for CryptoPotato readers at Bybit: Use this link to register and open a $500 FREE position on any coin!

Disclaimer: Information found on CryptoPotato is those of writers quoted. It does not represent the opinions of CryptoPotato on whether to buy, sell, or hold any investments. You are advised to conduct your own research before making any investment decisions. Use provided information at your own risk. See Disclaimer for more information.

Source: Original Article

RelatedPosts

Crypto

Litecoin Price Prediction: Is LTC Heading Toward $40 After Trendline Breakdown?

July 25, 2026
Crypto

Ripple Launches Ripple Mint for Institutional RLUSD Access

July 25, 2026
Crypto

Litecoin Approaches Descending Channel Breakout as Technical Momentum Builds

July 24, 2026
Forex Market

Summertime job market remains muggy

August 7, 2026
Forex Market

US labor market shows signs of weakness! July nonfarm payrolls unexpectedly decrease by 23,000; May and June data revised down sharply. Fed rate hike expectations cool down.

August 7, 2026
Forex Market

Nonfarm payrolls down in July; unemployment rate eases to 4.1%

August 7, 2026
Forex Market

US payrolls fall 23,000 in July in shock report; May, June figures sharply revised down

August 7, 2026
Next Post

(TIPS) Market Performance Analysis

Ripple Swim Capsules: The Speedo x BEAMS Capsule Returns for Just in Time for Summer

Dow Jones (US30) Hits Record High Ahead of a Critical Earnings Season

Market News Board | Market Analysis,Charts & News

MarketNewsBoard delivers trusted financial news, real-time market analysis, interactive charts, and economic insights across the global financial markets.

Covering Forex, Commodities, Stocks, Indices, Cryptocurrencies, and major economic events...

Market Overview

  • Forex Market
  • Commodities
  • Cryptocurrency News
  • Stocks
  • Indices
  • Crude Oil Prices
  • Economic Calendar

Resources

  • Central Banks News
  • Economy News
  • Interest Rate
  • Nonfarm Payroll
  • Charts

Tools

  • Currency Heat Map
  • Correlation Matrix
  • Market Sentiment
  • Currency Cross Rates
  • Crypto Rates
  • About Us
  • Contact Us
  • Disclaimer
  • Privacy Policy
  • Terms and Conditions

© 2026 MarketNewsBoard | Market Analysis, Charts & News.

AAPL
$313.45
AMZN
$260.28
BTC-USD
$78,797.34
EURUSD=X
$1.17
DX-Y.NYB
$99.15
NVDA
$209.66
TSLA
$345.82
DOW
$30.33
^N225
$66,097.62
JPY=X
$159.35
GBPUSD=X
$1.36
CAD=X
$1.39
NG=F
$2.90
BZ=F
$86.19
NFLX
$81.46
GOOG
$339.10
MSFT
$496.37
^RUT
$3,005.90
^FTSE
$10,878.12
AUDUSD=X
$0.718
CHF=X
$0.806
HG=F
$6.70
ETH=F
$2,498.50
No Result
View All Result
  • Home

© 2026 MarketNewsBoard | Market Analysis, Charts & News.