





TL;DR: CRSP (Centre for Research in Security Prices) indices are academically rigorous benchmarks used to track the US equity market across market capitalisations, styles, and sectors. With nearly USD 3 trillion in fund assets linked to them, they power some of the world’s largest exchange-traded funds (ETFs) and mutual funds. Understanding how CRSP indices work helps investors make more informed decisions about passive investment strategies.
If you have ever invested in a broad US market ETF, there is a good chance your money is already benchmarked against a CRSP index. The Centre for Research in Security Prices (CRSP) — originally founded at the University of Chicago Booth School of Business — has been shaping financial research and market measurement since 1960. Today, its indices serve as the academic backbone for passive investing, offering a transparent, rules-based framework that asset managers worldwide trust to construct and manage their funds.
This guide explains what CRSP indices are, how they are constructed, the main types available, and why they matter for investors seeking broad US market exposure through ETFs and index funds.
What Is CRSP and Why Does It Matter?
CRSP was established over 65 years ago with a clear mission: develop a rigorous, data-driven way to measure historical rates of return for US stocks. Before CRSP, there was no reliable, comprehensive database of US equity performance stretching back decades. The organisation filled that gap and, in doing so, fundamentally changed how investors and academics understand equity markets.
More than 500 leading academic, financial, and government institutions across 35 countries rely on CRSP’s research databases and indices, according to CRSP’s official website. In February 2026, Morningstar completed its acquisition of CRSP, bringing the CRSP Market Indices — which serve as benchmarks for around USD 3 trillion in US equity assets — into the Morningstar Indices family while maintaining their academic rigour and historical depth.
What sets CRSP apart is that its methodology was built in an academic setting rather than a commercial one. The indices are designed to be scientifically sound, consistently applied, and as accurate a reflection of the market as possible — earning the trust of some of the world’s largest fund managers.
How CRSP Indices Are Constructed
CRSP indices use a float-adjusted market capitalisation weighting system. Each company’s weight reflects the proportion of its shares that are freely tradeable on the open market, giving investors a realistic picture of the investable US equity universe.
Percentage-Weight Rather Than Fixed Constituent Counts
One of the most distinctive features of CRSP indices is that membership is based on a percentage-weight of the market, not an arbitrary fixed number of constituents. This contrasts with indices like the S&P 500, which maintains a fixed 500-stock membership subject to a committee’s discretion. By assigning companies to capitalisation tiers based on their share of total market value, CRSP creates a more objective and consistent framework.
The “Packeting” System
CRSP introduced an approach called “packeting” to manage how stocks migrate between index tiers. When a company’s market capitalisation crosses a tier boundary, CRSP does not shift the entire holding immediately. Instead, 50% of the security moves first; if the company remains beyond the new threshold in the following period, the remaining 50% transfers.
This gradual approach reduces index turnover, which lowers transaction costs for tracking funds, and maintains style purity — ensuring that transitional stocks do not distort either index’s characteristics unnecessarily.
Investability Screens
To ensure the indices remain practical for large institutional funds, CRSP applies investability screens based on float-adjusted market capitalisation and trading volume. Newly listed companies must meet a minimum trading history requirement before being considered for inclusion, filtering out highly illiquid securities.
The Main Types of CRSP Indices
CRSP offers a comprehensive family of indices covering the US equity market from multiple angles.
Total Market Index
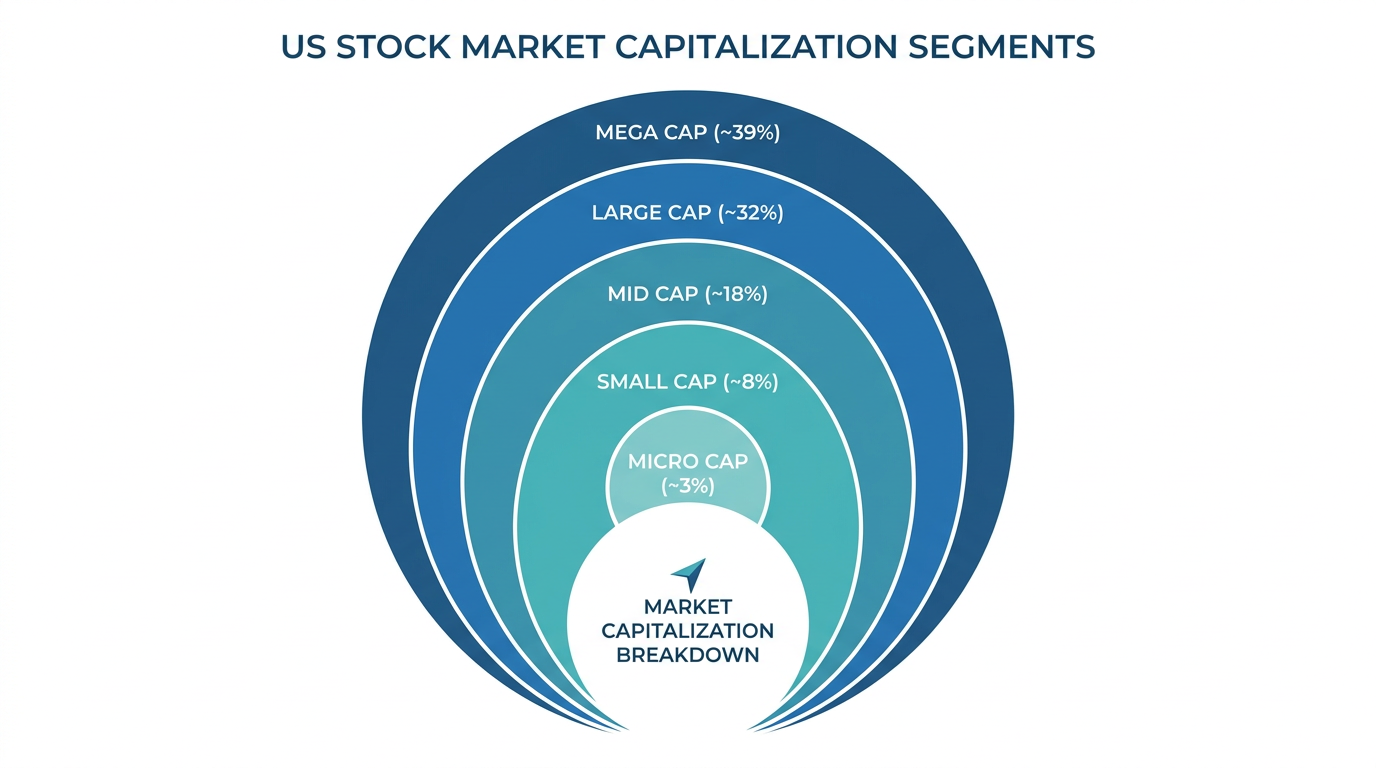
The CRSP US Total Market Index is arguably the most widely recognised in the family. It encompasses nearly 4,000 constituents across mega, large, mid, small, and micro-cap segments, covering close to the entire investable US equity market. According to CRSP, the Vanguard Total Stock Market Index Fund — with approximately USD 1.3 trillion in assets — uses this index as its benchmark, making it the largest mutual fund in the world by assets.
Capitalisation-Based Indices
CRSP divides the market into distinct capitalisation tiers based on percentage thresholds:
- Mega cap: Top 70% of US market capitalisation
- Mid cap: The next 15%, covering the 70%–85% range
- Small cap: Roughly 13% of the market, from the 85th to 98th percentile
- Micro cap: The remaining approximately 2% of market capitalisation
This tiered structure allows investors and fund managers to gain targeted exposure to specific segments of the US market.
Growth and Value Style Indices
CRSP offers style indices that classify securities as either growth- or value-oriented using a transparent, rules-based multi-factor model. Value classifications draw on factors such as the book-to-price ratio, forward earnings-to-price ratio, and dividend-to-price ratio. Growth classifications assess projected earnings growth, short-term earnings forecasts, and historical sales data.
Sector Indices
CRSP sector indices start from the CRSP US Core Cap Index and apply the Uniform Entity Sectors (UES) classification system, organising companies across 11 industry sectors to ensure each company is assigned appropriately.
CRSP Indices vs the S&P 500
Investors often compare CRSP-benchmarked funds with those tracking the S&P 500. Understanding the key distinctions can help clarify which benchmark better suits a given investment objective.

The S&P 500 holds approximately 500 large-cap US companies and represents roughly 80% of the US market by value, with a committee making final inclusion decisions. The CRSP US Total Market Index covers nearly 4,000 companies across all capitalisation tiers through a largely rules-based process, with minimal human intervention in rebalancing or weighting decisions.
Their long-term returns have historically been broadly similar, though during periods when smaller companies rally, total market indices may diverge more noticeably from large-cap-only benchmarks. Past performance does not indicate future results, and both indices carry market risks that investors should evaluate against their own circumstances.
Tip: When comparing ETFs, check which index each fund tracks. Two funds described as “US total market” funds may track different benchmarks with different constituent counts and weighting rules, which can lead to meaningfully different portfolio characteristics over time.
Practical Considerations for Singapore Investors
Singapore-based investors accessing US markets through ETFs or index funds may encounter CRSP-benchmarked products listed on US exchanges. A few practical factors are worth keeping in mind.
Even well-constructed index funds will not perfectly replicate their benchmark. The gap between a fund’s return and its index’s return — called tracking error — is typically very small for large, liquid index funds. However, costs such as fund management fees and dividend reinvestment mechanics all contribute to this difference.
Investors in Singapore trading US-listed ETFs also face currency conversion between Singapore dollars and US dollars, as well as US withholding tax on dividends. These factors affect net returns relative to the index’s gross return. Investors should review their tax circumstances with a qualified adviser before making investment decisions.
For those interested in learning more about US market trading mechanics, this guide on US market hours for Singapore investors provides a useful starting point. Singapore investors can explore a broader range of investment products for US market exposure through a platform licensed by the Monetary Authority of Singapore (MAS), such as Longbridge, which provides access to US stocks, ETFs, and REITs.
Frequently Asked Questions
What does CRSP stand for?
CRSP stands for Centre for Research in Security Prices. Originally founded at the University of Chicago Booth School of Business, CRSP has provided financial market data and index benchmarks since 1960. As of February 2026, CRSP was acquired by Morningstar, and its market indices are now part of the Morningstar Indices family.
Which ETFs track CRSP indices?
The most widely known ETF tracking a CRSP index is the Vanguard Total Stock Market ETF (ticker: VTI), which benchmarks against the CRSP US Total Market Index. Vanguard also uses CRSP indices for several of its capitalisation and style-specific funds, including small-cap and value index funds.
What is “packeting” in CRSP index methodology?
“Packeting” refers to CRSP’s approach to managing stocks migrating between capitalisation tiers. Rather than shifting an entire position at once, CRSP moves 50% of the security in the first period after it crosses a threshold, and the remaining 50% if it stays beyond the outer boundary in the following period. This reduces index turnover and the associated transaction costs for tracking funds.
How does the CRSP US Total Market Index differ from the S&P 500?
The CRSP US Total Market Index covers nearly 4,000 US companies across all market capitalisation sizes, from mega-cap to micro-cap, using a rules-based methodology. The S&P 500 tracks approximately 500 large-cap companies using a committee-based selection process with profitability filters, representing roughly 80% of the US market by value.
Conclusion
CRSP indices represent one of the most academically grounded and widely adopted benchmarking frameworks in passive investing. Their rules-based methodology, capitalisation-percentage approach, and the innovative packeting system distinguish them from other index providers. With nearly USD 3 trillion in assets benchmarked against CRSP indices, they form a fundamental part of the global investment landscape.
For Singapore investors exploring US market exposure through index funds or ETFs, understanding how these benchmarks are constructed helps you assess which fund’s approach aligns with your portfolio goals and risk tolerance. Different index methodologies can meaningfully affect portfolio characteristics over time.
The choice of financial instruments depends on your investment objectives, risk tolerance, market outlook, and experience level. Regardless of the method selected, it is essential to fully understand its mechanics, risk characteristics, and execution rules, while maintaining a robust risk management plan. You can learn more about investment strategies through the Longbridge Academy or by downloading the Longbridge App.
Source: Original Article