






















Bitcoin technical analysis indicates that BTC▲$62,630.00 is stuck near $63,000 after the asset’s June low near $58,300. The market is no longer extremely oversold but has failed to recover the moving averages that would suggest a trend reversal. Bitcoin key levels between $60,000 and $65,150 could therefore define whether this becomes a BTC breakout or a BTC breakdown.

Contents
Bitcoin Price Today: BTC Enters a Critical Decision Zone
Current Bitcoin Price Action and Market Structure
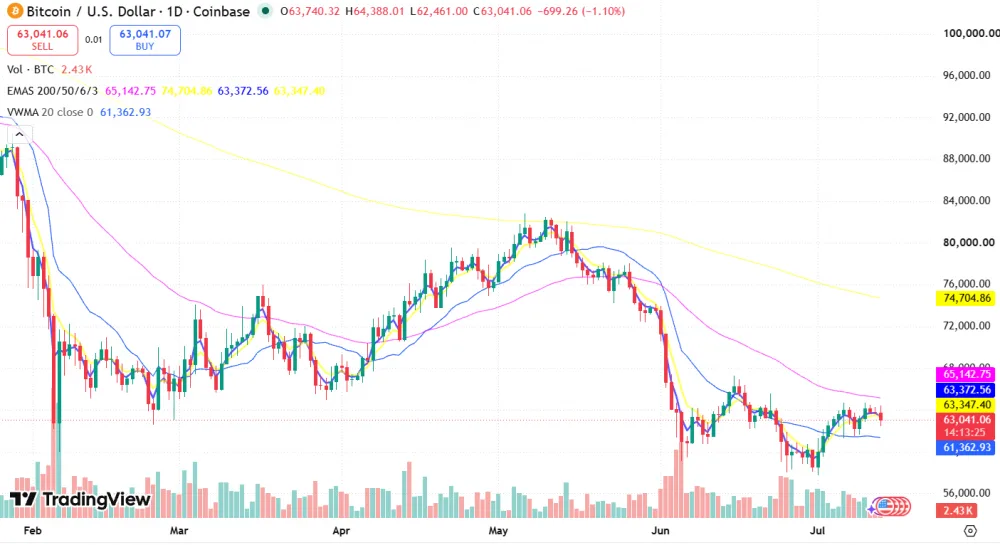
As of writing, BTC traded at $63,041 on Coinbase, down 1.10% for the day after opening at $63,740. The daily range was between $62,461 and $64,388, while the displayed Coinbase volume was around 2,430 BTC.
The price action is higher than the recent swing low but below the bearish 50-day and 200-day exponential moving averages. The broader market structure hence remains corrective despite the June rebound.
Related: Can Bitcoin Crash to $20K in 2026? What Could Trigger a Historic Crypto Market Collapse
Why Traders Are Calling This a Make-or-Break Moment
Bitcoin is currently caught between support near $60,000–$61,400 and resistance around $63,350–$65,150.
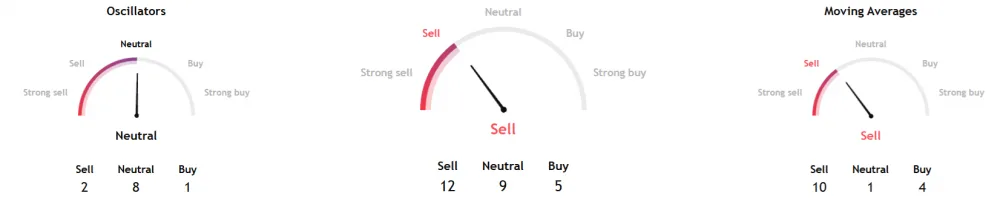
TradingView’s daily summary reads “Sell,” with 12 sell, nine neutral, and five buy signals. Oscillators are neutral with two sell, eight neutral, and one buy signal, while moving averages are bearish with ten sell, one neutral, and four buy signals. The platform’s overall technical assessment for the daily, weekly, and monthly timeframes is also bearish.
Source: TradingView
Bitcoin’s Recent Pullback and Recovery Attempt Explained
BTC declined from the peak near $82,000 in May 2026 to below $60,000 in June 2026 before recovering toward $64,400. The price behavior indicates a short-term improvement but not a reversal of the larger downtrend.
The BTC next move after correction depends on whether buyers can turn the current level near $63,000 into support.
Bitcoin Technical Analysis: Key Levels Traders Are Watching

Bitcoin Support Levels: Where Could BTC Find Buyers?
The immediate Bitcoin support levels include the daily low near $62,460, with the next level at the 20-day VWMA near $61,363.
The major support area is between $60,000 and $61,000, with the next level at the recent swing low near $58,300. A breakdown below this level would target the realized-price area near $53,000.
Bitcoin Resistance Levels: What BTC Must Break to Resume the Rally
The immediate Bitcoin resistance levels are the short-term EMAs near $63,347–$63,373 and the daily high near $64,388.
The next key obstacle is the 50-day EMA near $65,143. A daily close above this level would target $66,000, $68,000, the short-term-holder cost basis near $72,200, and the 200-day EMA near $74,705.
Source: TradingView
The $60,000–$63,000 Zone: Why This Area Matters for Bitcoin
The BTC support and resistance levels between $60,000 and $63,000 are worth close attention because they represent a confluence of technical factors, including a major psychological level, recent lows, the 20-day VWMA, and several weeks of two-way trading.
These are among the main Bitcoin key levels to watch. A confirmed daily close outside this range could accelerate the Bitcoin next move as stop orders and leveraged positions are cleared.
Related: Top 5 Altcoins for the Next 100x Crypto – Best Crypto to Buy Now 2026
Bitcoin Chart Analysis: Bullish vs Bearish Scenarios
Bull Case: What Happens If Bitcoin Breaks Above Resistance?
A close above $65,150 would weaken the bearish scenario and see the price test the $66,000–$68,000 area.
A BTC breakout above this band would target $72,200 and $74,700. The next confirmation for a bullish scenario would be a retest of the 200-day EMA, as reclaiming it would indicate that the correction may be ending.
Bear Case: What Happens If BTC Loses Key Support?
A close below $61,300 would see pressure return to the $60,000 level, with another test of the $58,300 area likely if this support also breaks. The next bearish scenario would see the price target $56,000 and $53,000.
The BTC chart analysis indicates that range-bound action is likely in the short term, as neither the bearish nor bullish case has sufficient evidence to overcome the opposite scenario.
The Price Targets That Could Follow a Breakout or Breakdown
The BTC price targets following a breakout or breakdown are as follows:
| Scenario | Confirmation | Main targets |
|---|---|---|
| Bullish | Close above $65,150 | $68,000, $72,200, $74,700 |
| Neutral | Price holds $60,000–$65,150 | Continued range trading |
| Bearish | Close below $58,300 | $56,000, $53,000 |
Bitcoin Indicators Signal a Battle Between Bulls and Bears
RSI Analysis: Is Bitcoin Overbought or Oversold?
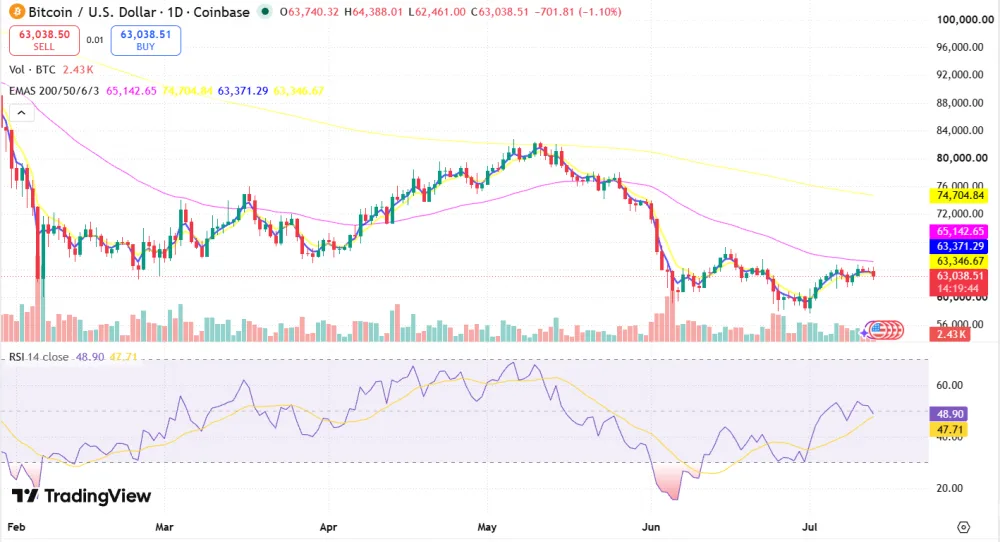
The 14-day RSI is at 48.90, with the RSI moving average at 47.71. The reading hence suggests that the price is in neutral territory.
Source: TradingView
The RSI needs to move above 50–55 to indicate that the downtrend has reversed, while a move below 40 would suggest that bears have gained control.
Moving Averages: What the 50-Day and 200-Day MAs Suggest
BTC is below the 50-day EMA at $65,143 and far below the 200-day EMA near $74,705. The price is hence in a bearish trend according to the moving-average indicator.
The shorter EMAs near $63,350 are almost flat and hence indicate consolidation rather than a bullish trend.
MACD and Momentum Signals for BTC
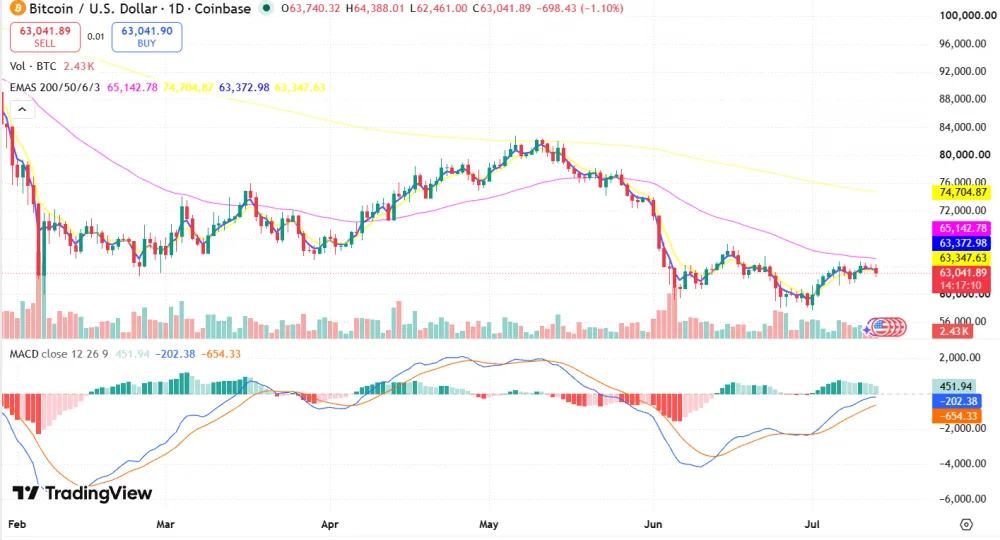
The MACD line is around -202, above the signal line at -654, with the histogram at approximately 452. The indicator hence suggests that bearish momentum is losing strength but remains negative.
Source: TradingView
The MACD line needs to move above zero for a definitive bullish signal, but the current MACD readings indicate that the downtrend is losing strength.
Bitcoin Volume and Liquidity Analysis
Why Trading Volume Could Decide Bitcoin’s Next Move
The recent price rebound needs expanding volume to confirm that demand is improving. The latest daily chart by CME Group did not show such volume confirmation.
Institutional ETF trading volume has also been lower than the peak seen during the bull market. A high-volume BTC breakout is therefore required to show that buying pressure is stronger than short covering.
Key Liquidity Zones Above and Below BTC Price
The main liquidity zones above BTC are likely to be around $64,400, $65,150, and the options max-pain level near $66,000.
Below the price, liquidity is likely to cluster around $61,300, $60,000, and $58,300. These levels hence present potential liquidity zones for a BTC breakdown or breakout.
Related: Bitcoin Rally May Have to Wait for a Clear Catalyst, Analysts Say
Are Bitcoin Whales Accumulating or Selling?
They do both. Glassnode’s analysis indicates that accumulation has returned across wallet sizes.
Wallets holding between 100–1,000 BTC have been accumulating, while 1,000–10,000 BTC wallets have also turned into net buyers.
However, long-term-holder realized losses were near $280 million per day, the highest level since December 2022. Some older and large wallets were hence still selling BTC even as others bought the dip.
Bitcoin On-Chain Data: What Blockchain Metrics Reveal
Exchange Inflows and Outflows: Are Investors Selling BTC?
Exchange inflows and outflows can indicate whether investors are distributing or moving BTC into longer-term custody.
Rising exchange inflows generally increase the amount of Bitcoin immediately available for sale, while sustained outflows can indicate accumulation. Current evidence points toward selective accumulation rather than a broad rush to exchanges. However, overall on-chain demand is not yet strong enough to indicate that selling pressure has ended.
Bitcoin Holder Behavior and Market Sentiment
Long-term holders have returned to accumulation mode, but their behavior is still mixed.
Approximately 10.83 million BTC were recently held at a loss compared with 9.22 million BTC held in profit. The number of underwater investors hence remains high. Their behavior could influence the price action, with many likely to sell during a recovery and create resistance.
Institutional Demand and ETF Flows Impacting BTC
U.S. spot Bitcoin ETF flows have been inconsistent, with Farside recording $265.7 million of net inflows on July 6, $21.5 million of inflows on July 7, $84.9 million of outflows on July 8, $95.3 million of outflows on July 9, and $90.4 million of inflows on July 10.
Glassnode’s 30-day average for ETF flows was still negative at around -$88.9 million per day. Daily ETF trading volume was also around $650 million–$950 million, or approximately 80% below the October 2025 peak.
Bitcoin Technical Analysis: Short-Term BTC Price Prediction

Bitcoin Price Forecast for the Next Few Days
The short-term Bitcoin forecast remains neutral to bearish while the price stays below $65,150. BTC is likely to range between $61,300 and $65,150 in the short term, with improving momentum but bearish moving averages.
BTC Weekly Outlook: Key Levels to Watch
A weekly hold above $60,000 would keep the bullish scenario alive, with a close above $65,150 being even more convincing. Closing above $65,150 would improve the Bitcoin price analysis and target $68,000 in the short term and potentially $72,200–$74,700 in the medium term.
However, a weekly close below $58,300 would instead indicate that bears have regained control.
Possible Bitcoin Targets If Bulls Regain Control
The BTC price targets if bulls take over include:
- $66,000
- $68,000
- $72,200
- $74,700–$76,600
The final area contains the 200-day EMA and important on-chain cost-basis levels. Bitcoin would need to reclaim it before traders could discuss a broader bullish reversal with confidence.
Bitcoin Macro Factors That Could Impact the Next Move
Federal Reserve Policy and Interest Rate Expectations
The Federal Reserve left rates on hold at the 3.50%–3.75% target range at its June meeting. Rates have been in this range since the beginning of 2026.
Higher-for-longer assumptions and higher real yields hurt the performance of non-yielding assets such as Bitcoin. An improvement in the Fed’s outlook would be a positive sign for BTC.
Stock Market Correlation and Risk Appetite
BTC has been performing in tandem with risk assets, with Glassnode noting that the price often moves with U.S. and European stocks when oil prices rise and risk appetite drops.
This correlation means that a drop in stocks, rising oil prices, or a stronger U.S. dollar could hurt Bitcoin. An improvement in risk appetite would enable BTC to break above the resistance levels.
How Institutional Flows Could Influence Bitcoin’s Trend
Institutional demand for Bitcoin is mixed. Spot ETF flows have been lower than the peak seen during the bull market and remain inconsistent on a daily basis.
Consistent inflows rather than isolated positive days would be a more reliable sign that institutional investors are accumulating BTC. Renewed ETF redemptions could hurt the price and keep bears in control.
Bitcoin Market Sentiment: Are Traders Turning Bullish Again?
Fear and Greed Index Analysis
The Crypto Fear and Greed Index was at 28 on July 13, suggesting that the market was in the “Fear” category. The reading had improved slightly from 26 on July 12 but remained defensive.
The improvement suggests that some investors have turned more bullish, but the reading does not indicate that the market has reached a bottom. Fear and uncertainty still dominate the crypto market, with price action remaining range-bound.
Derivatives Data and Leverage Risks
The Bitcoin options open-interest put/call ratio dropped to 0.56, the lowest level in 2026, with perpetual funding below the approximately 0.01% neutral level. Long positioning was not severely overcrowded.
The options market was pricing a downside bias, with BTC below the $66,000 aggregated max-pain level. The derivatives market therefore showed cautious optimism rather than outright bullish confidence.
What Crypto Traders Are Watching Before the Next BTC Move
Crypto traders are likely to be watching $65,150, $60,000, ETF flows, volume, and whether RSI can stay above 50.
Bitcoin technical analysis today suggests that bulls and bears are in a tight battle, with improving momentum but a bearish trend structure.
Bitcoin Technical Analysis: What Comes Next for BTC?
Bullish Scenario: Bitcoin Breakout Toward New Highs
The bullish scenario requires daily closes above $65,150 and $68,000 to begin with. BTC technical analysis would then suggest that $72,200–$76,600 is the next target before testing the May peak near $80,000–$82,000.
Neutral Scenario: BTC Continues Trading in a Range
BTC is likely to range between $60,000 and $65,150 while volume remains low. Bitcoin technical analysis July 2026 would still be bearish beneath the 50-day EMA but show improvement in short-term momentum.
Bearish Scenario: Bitcoin Correction Extends Lower
A bearish scenario would see the price break below $60,000 and $58,300, with BTC technical analysis pointing toward $56,000 and $53,000 as the next targets.
Overall, Bitcoin technical analysis is not bullish, as the price remains below the key moving averages and institutional demand is inconsistent. The market needs a confirmed breakout above $65,150 or a breakdown below $58,300 before the Bitcoin next move can be identified with a higher degree of confidence.
FAQ
What is Bitcoin technical analysis?
Bitcoin technical analysis involves using price, volume, momentum, and chart structure to identify potential market scenarios.
What are the most important BTC support and resistance levels?
The most important BTC support and resistance levels are $61,300, $60,000, and $58,300 on the downside, while the key resistance levels are $65,150, $68,000, and $74,700.
Is Bitcoin bullish or bearish right now?
Is Bitcoin bullish or bearish? BTC is neutral in terms of short-term momentum but bearish in terms of the larger trend structure.
Will Bitcoin break above resistance?
Will Bitcoin break resistance in the next few days? That depends on demand and volume. A daily close above $65,150 would improve the odds of a move toward $68,000.
Can Bitcoin fall below $60,000?
Yes, it can, especially if $61,300 breaks. A loss of $58,300 would confirm a deeper correction.
What indicators are best for Bitcoin analysis?
The best indicators for Bitcoin analysis include RSI, MACD, moving averages, volume, VWMA, support and resistance, ETF flows, on-chain data, and derivatives positioning.
What is the Bitcoin price prediction for 2026?
The Bitcoin price prediction 2026 is conditional on whether $65,150 can be reclaimed to target $74,700–$76,600 or whether $58,300 breaks, exposing the $53,000 area.
Source: Original Article