























Thursday, July 9, 2026
No Result
View All Result
  • Home
  • Market Overview
    • All
    • Crude Oil Prices
    • Cryptocurrency News
    • Economy News
    • ETFs
    • Foreign Exchange News
    • Indices
    • Stock Market

    (EMP.A) Market Performance Analysis

    How GEO Group’s Shift From Russell Growth To Value Indices Has Changed Its Investment Story (GEO)

    Pricing houses in bitcoin (BTC) exposes dollar’s debasement: Crypto Daily

    New Champions of the World Economies

    Brazil’s B3 exchange introduces options on BTC, ETH, SOL futures

    REG – PIMCO ETFs PLC

    • Crude Oil Prices
    • Cryptocurrency News
    • Economy News
    • ETFs
    • Indices
    • Stock Market
    • Foreign Exchange News
    • Commodities News
  • Forex Market
    • All
    • Central Banks News
    • Currencies
    • Interest Rate
    • Nonfarm Payroll

    Pound Decisively Regains Investor Trust. Forecast as of 09.07.2026

    South-east Asia’s central banks now face questions beyond oil shocks – peace deal or not

    GBP/JPY Price Forecast: Pound consolidates after hitting fresh all-time highs at 218.00

    Our latest views on the major central banks

    UBS favors New Zealand dollar after central bank rate hike

    United States Dollar Index Forecast: Tests 23.6% Fibo. below 101.00

    Taiwan central bank chief warns of AI bubble risk

    USD/CHF Price Forecast: Dollar bulls lose steam after rejection at 0.8100

    Malaysia Central Bank Remains on Hold as Mideast Tensions Rekindle

    • Central Banks News
    • Currencies
    • Interest Rate
    • Nonfarm Payroll
  • Commodities
    • All
    • Gold
    • Oil and Gas
    • Silver

    Gold prices today, Thursday, July 9, 2026: Prices open lower as U.S.-Iran airstrikes continue

    Oil and Gas Electrification and Automation: Modernizing Field Logistics and Operations

    Bernstein sees higher gold prices in H2’26, sets new price target

    UW taps longtime oil and gas advocate Obermueller to lead School of Energy Resources

    Oil Price Surge Shows Markets Were Too Relaxed About Iran Deal

    HSBC lowers 2026-27 gold price forecasts on hawkish Fed tilt

    • Gold
    • Oil and Gas
    • Silver
  • Crypto
    • All
    • Bitcoin
    • Ethereum
    • Litecoin
    • Ripple
    • Solana
    • XRP

    XRP price prediction after breakout puts $1.14 and $1.18 back in focus

    Ethereum Price Rises To $1.754k Ahead Of ETF Launch

    What Is CashCat Crypto? Why Robinhood’s Memecoin Is Exploding

    XRP price holds near $1 as traders focus on next move

    Solana price today trapped at $78 as Fear & Greed drops to 22

    Will Bitcoin Drop to $50,000 as Saylor's Strategy Sells $216 Million in BTC?

    • Bitcoin
    • Ethereum
    • Litecoin
    • Ripple
    • Solana
    • XRP
  • Charts
  • Economic Calendar
No Result
View All Result
Home Crypto

XRP price prediction after breakout puts $1.14 and $1.18 back in focus

by MarketNewsBoard
1 hour ago
in Crypto, XRP
Share on FacebookShare on Twitter

XRP has recovered from this week’s sharp sell-off after defending the $1.07 support zone, with traders weighing an emerging bullish chart breakout against persistent geopolitical and regulatory risks that continue to cap upside.

Summary

  • XRP has rebounded from $1.07 after defending key support, while a descending channel breakout has revived bullish sentiment.
  • RSI bullish divergence, improving MACD momentum, and liquidation clusters near $1.14 support the case for further upside.
  • Geopolitical tensions, ETF outflows, and uncertainty over the CLARITY Act remain key risks that could derail the recovery.

According to data from crypto.news, XRP (XRP) price was trading near $1.09 at press time after rebounding from Tuesday’s low of around $1.07, though it remained below the July 4 peak near $1.18.

Risk appetite improved slightly after the initial wave of selling tied to escalating U.S.-Iran tensions eased, but sentiment across the altcoin market remains cautious following more than $400 million in crypto liquidations earlier this week. XRP itself accounted for over $8.6 million in long liquidations during the sell-off, underscoring how heavily leveraged positioning amplified the decline.

Adding to the recovery narrative, analyst Gerla believes XRP has completed a notable technical milestone.

“$XRP just broke out of its descending channel. Now it’s retesting the breakout while RSI prints a bullish divergence. If support holds, this could be the start of the next leg higher.”

While the short-term bounce has attracted fresh buyers, institutional sentiment has yet to fully recover. Spot XRP exchange-traded funds recorded roughly $7.29 million in net outflows on July 8, the largest single-day withdrawal since March.

At the same time, legislative uncertainty continues after the White House missed its July 4 target for passing the CLARITY Act, leaving investors without the regulatory catalyst many had expected to support digital assets during the summer.

Technical structure favors recovery if XRP holds above key support

The daily chart shows XRP stabilizing just above its 20-day simple moving average near $1.05 after briefly slipping below the psychologically important $1.10 level. Although price remains beneath the 50-day, 100-day, and 200-day moving averages clustered between $1.17 and $1.46, the 20-day average has flattened, while Chaikin Money Flow has climbed back above zero, suggesting capital has started returning after several weeks of distribution.
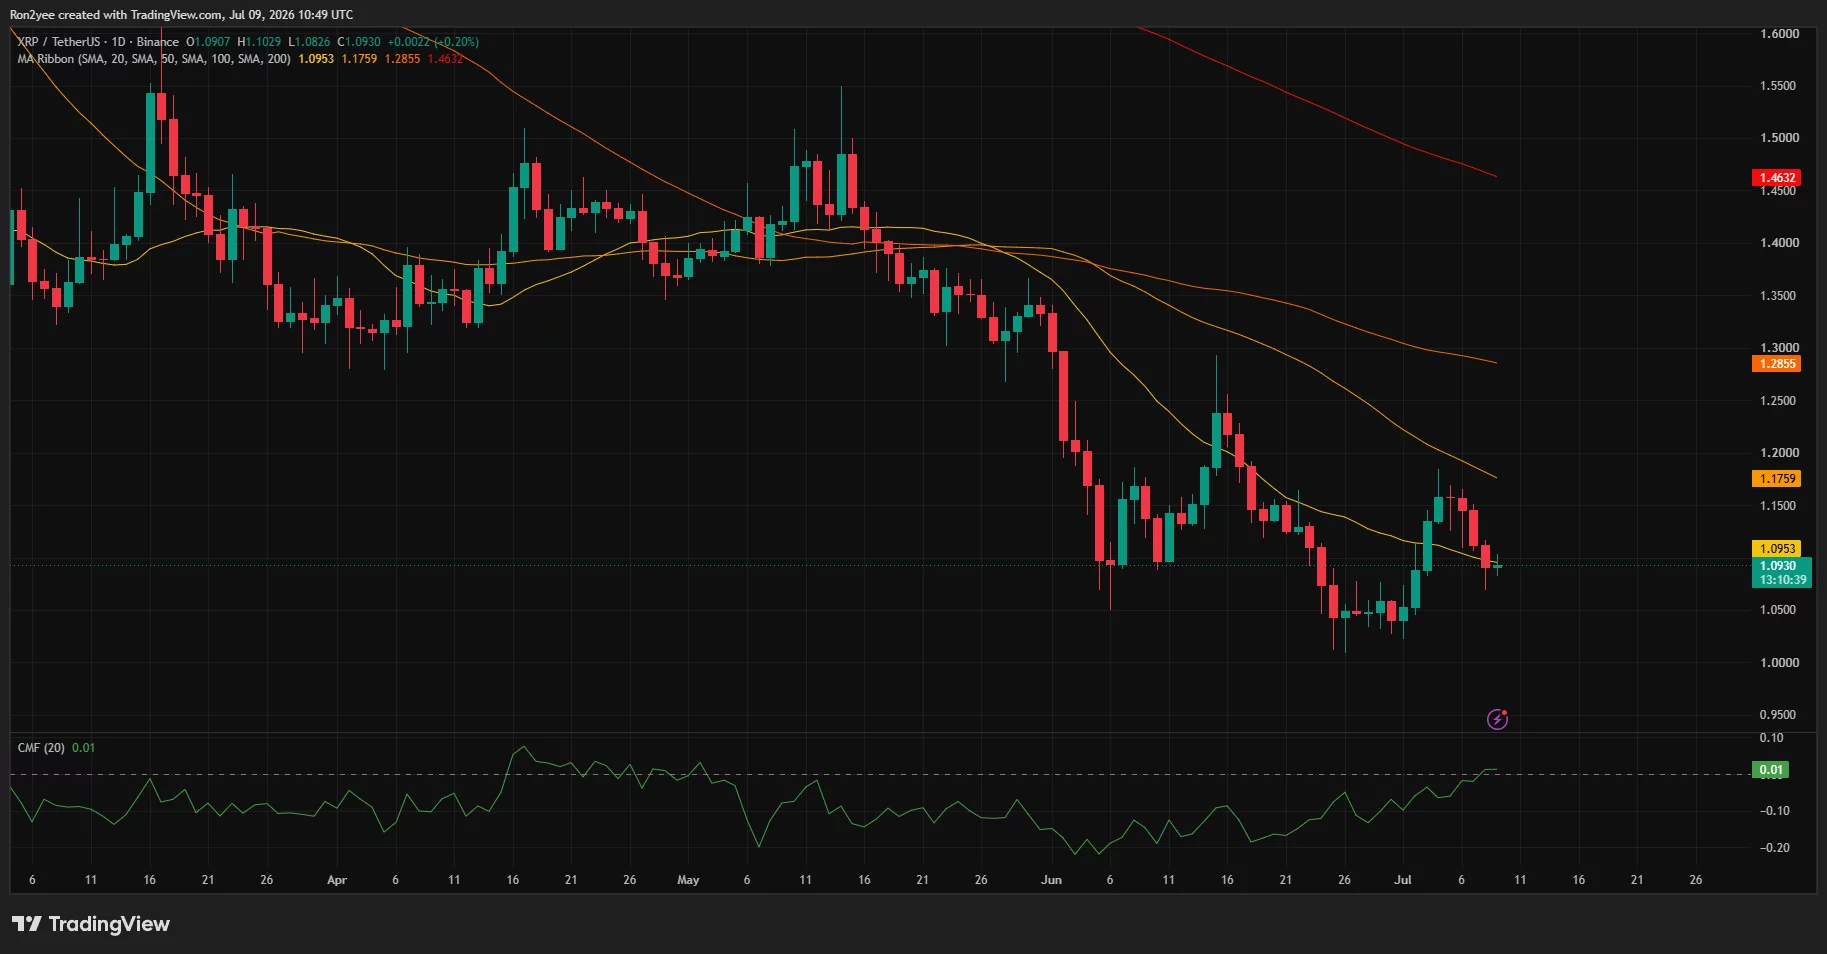
XRP daily chart showing price holding above the 20-day SMA near $1.05 while remaining below the 50, 100, and 200-day moving averages.
XRP daily price chart — July 9 | Source: crypto.news

The 4-hour chart presents a more constructive setup. XRP has reclaimed the 0.382 Fibonacci retracement near $1.076 and is attempting to establish support around the 0.5 retracement at $1.097.
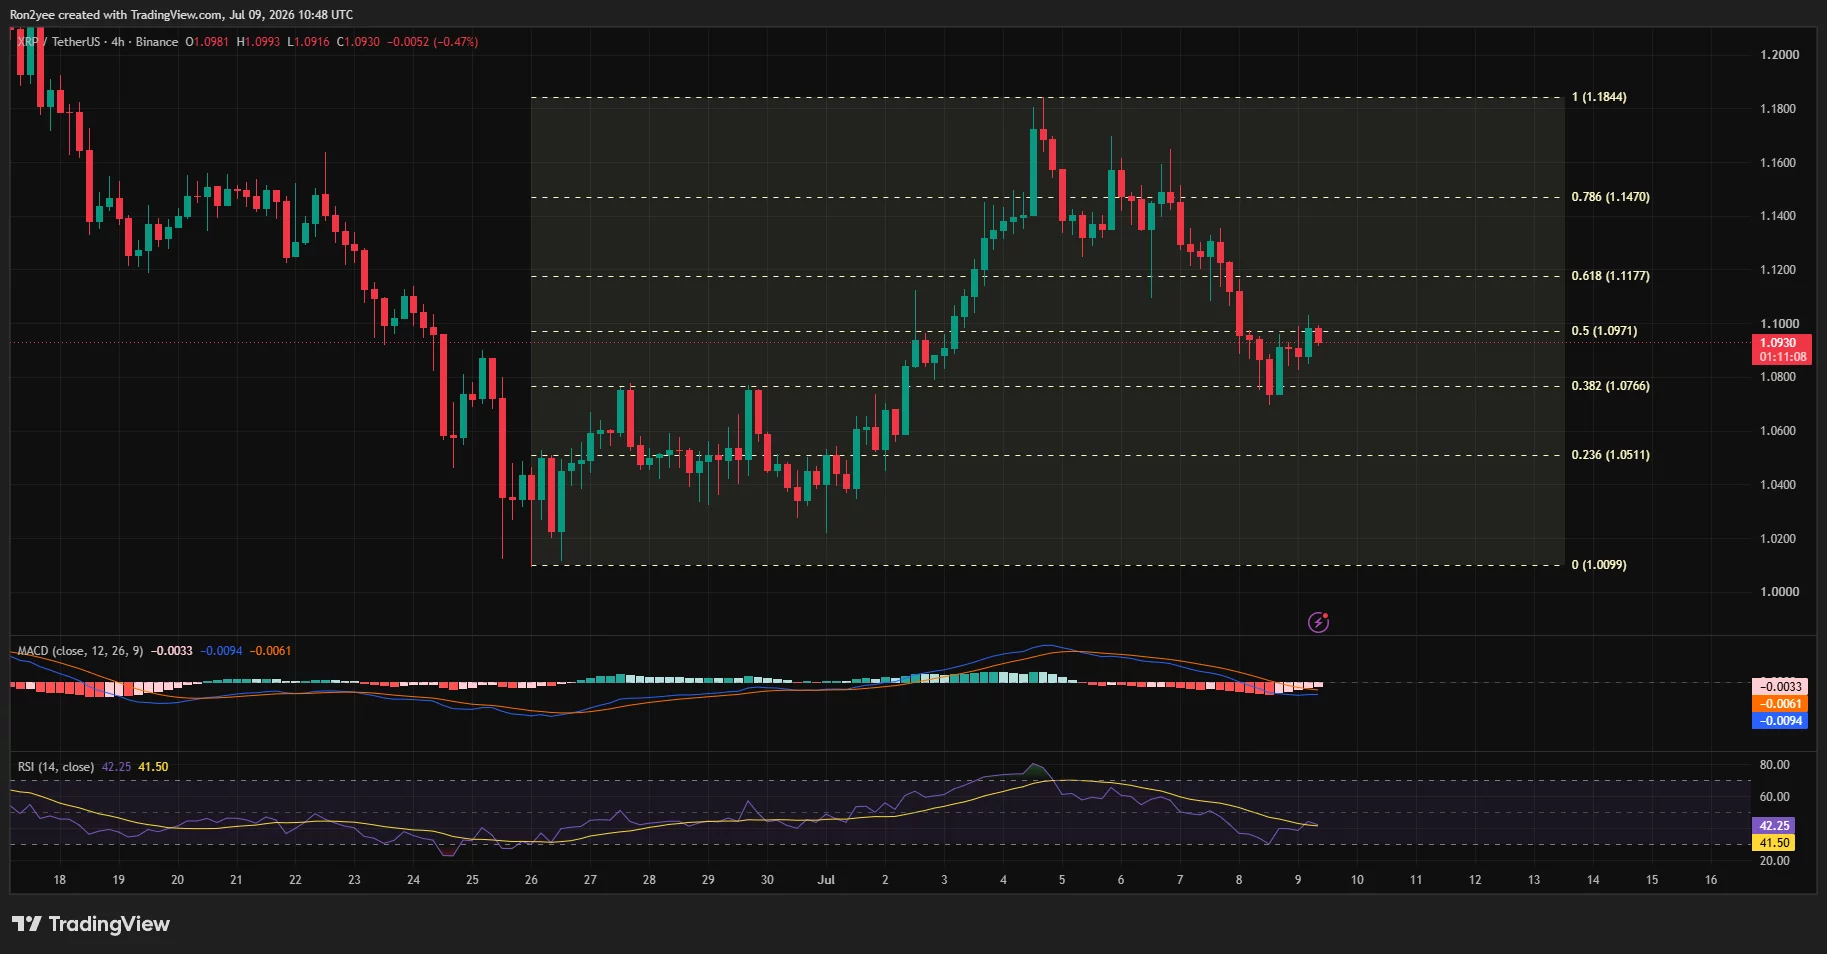
XRP 4-hour chart showing a rebound from the 38.2% Fibonacci level, with RSI bullish divergence and MACD nearing a bullish crossover.
XRP 4-hour price chart — July 9 | Source: crypto.news

Meanwhile, the MACD histogram has nearly returned to positive territory as the MACD and signal lines converge, while the RSI has rebounded toward 42 after printing higher lows despite price registering fresh local lows. That bullish divergence closely aligns with Gerla’s descending-channel breakout thesis.

Derivatives positioning also leaves room for volatility. CoinGlass liquidation data shows one of the largest short liquidation clusters sitting around $1.14, with additional liquidity concentrated near $1.18.
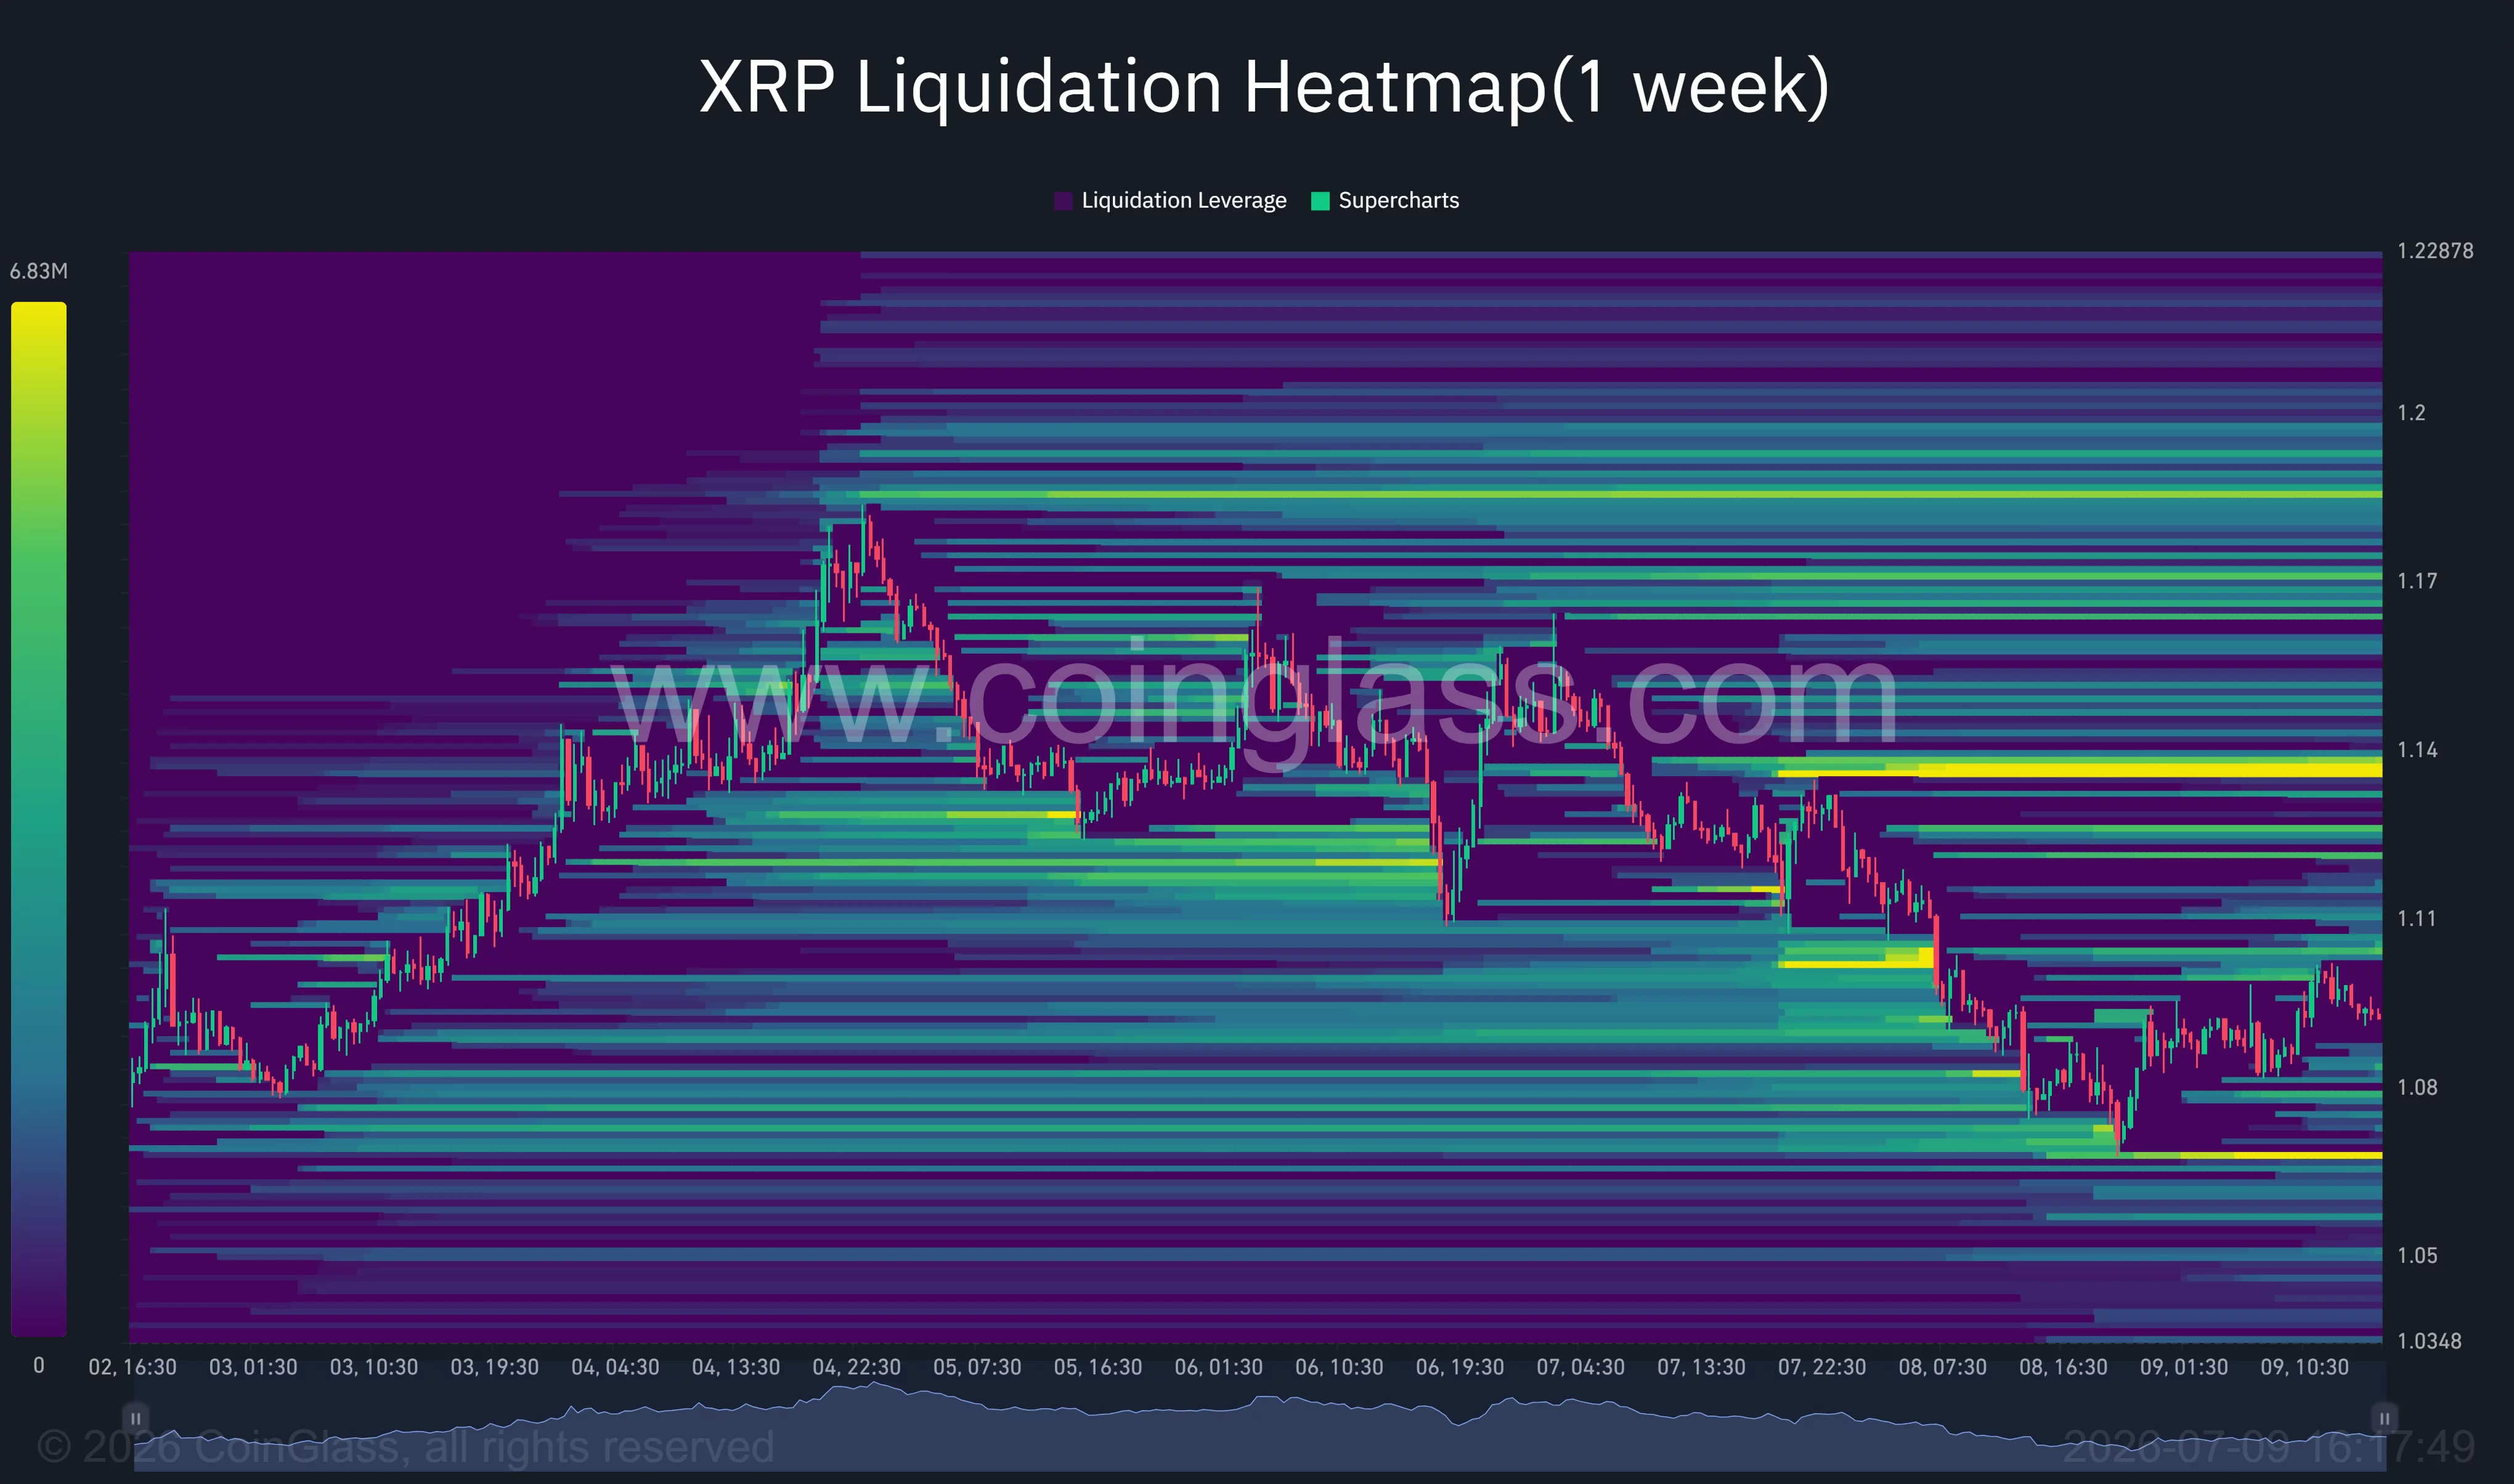
XRP one-week liquidation heatmap highlighting major liquidity clusters around $1.14 and $1.18, with support concentrated near $1.07.
XRP liquidation heatmap | Source: CoinGlass

A sustained move through those levels could trigger forced short covering and accelerate a rally toward the 50-day moving average near $1.18. Conversely, downside liquidity has become thinner until roughly $1.07, reducing immediate liquidation pressure if buyers continue defending current levels.

Macro risks still threaten the bullish setup

Several external risks could quickly invalidate the recovery scenario despite improving chart signals.

Geopolitical uncertainty remains the most immediate concern after the United States launched strikes against Iranian military targets and President Donald Trump formally ended the previous ceasefire framework. Any further escalation in the Middle East could renew demand for defensive assets and pressure cryptocurrencies, particularly higher-beta altcoins such as XRP.

Regulatory developments also remain unresolved. The delayed Senate vote on the CLARITY Act continues to weigh on sentiment, while institutional demand could remain subdued if ETF flows stay negative. On-chain activity has also shown large-holder wallets distributing tens of millions of XRP during the recent decline, suggesting some whales continue reducing exposure into rebounds.

From a technical perspective, losing support at $1.07 would invalidate the emerging breakout structure and expose XRP to the June swing low near $1.01. A decisive move above $1.10 would strengthen the bullish case, while reclaiming $1.14 and then $1.18 could shift momentum back in favor of buyers and open the door for another attempt at the late-May highs.

Disclosure: This article does not represent investment advice. The content and materials featured on this page are for educational purposes only.

Source: Original Article

Previous Post

Pricing houses in bitcoin (BTC) exposes dollar’s debasement: Crypto Daily

Next Post

GBP/JPY Price Forecast: Pound consolidates after hitting fresh all-time highs at 218.00

RelatedPosts

Ethereum Price Rises To $1.754k Ahead Of ETF Launch

by MarketNewsBoard
2 hours ago

Ethereum Price Rises to $1.754k Ahead of ETF LaunchEthereum (ETH) price increased 1.16% to $1,753.98 on Thursday, closely tracking a broader market gain of 1.38%....

Read moreDetails

What Is CashCat Crypto? Why Robinhood’s Memecoin Is Exploding

by MarketNewsBoard
2 hours ago

Contents1.💰What Is CashCat Crypto?2.💰How Does CashCat Crypto Work?3.💰Why Is CashCat Crypto Surging?4.💰What Makes CashCat Different From Other Memecoins?5.💰Is CashCat Crypto a Good Investment?6.🛠️How to Buy...

Read moreDetails
Next Post

GBP/JPY Price Forecast: Pound consolidates after hitting fresh all-time highs at 218.00

How GEO Group’s Shift From Russell Growth To Value Indices Has Changed Its Investment Story (GEO)

Recommended.

Oil rises after US launches fresh strikes against Iran

July 9, 2026

Multimillion-dollar encore extends CHC choppers’ Norwegian oil & gas run until 2030

July 3, 2026

Trending.

No Content Available
Market News Board | Market Analysis,Charts & News

MarketNewsBoard delivers trusted financial news, real-time market analysis, interactive charts, and economic insights across the global financial markets.

Covering Forex, Commodities, Stocks, Indices, Cryptocurrencies, and major economic events...

Follow Us

Market Overview

  • Forex Market
  • Commodities
  • Cryptocurrency News
  • Stocks
  • Indices
  • Crude Oil Prices
  • Economic Calendar

Resources

  • Central Banks News
  • Economy News
  • Interest Rate
  • Nonfarm Payroll
  • Charts

Tools

  • Currency Heat Map
  • Correlation Matrix
  • Market Sentiment
  • Currency Cross Rates
  • Crypto Rates
  • About Us
  • Contact Us
  • Disclaimer
  • Privacy Policy
  • Terms and Conditions

© 2026 MarketNewsBoard | Market Analysis, Charts & News.

AAPL
$313.39
AMZN
$243.62
BTC-USD
$62,578.83
EURUSD=X
$1.14
DX-Y.NYB
$100.98
NVDA
$204.12
TSLA
$394.06
DOW
$29.03
^N225
$67,743.85
JPY=X
$162.44
GBPUSD=X
$1.34
CAD=X
$1.42
NG=F
$3.19
BZ=F
$78.70
NFLX
$75.59
GOOG
$358.71
MSFT
$383.34
^RUT
$2,956.39
^FTSE
$10,434.82
AUDUSD=X
$0.694
CHF=X
$0.807
HG=F
$6.25
ETH=F
$1,743.50
No Result
View All Result
  • Home

© 2026 MarketNewsBoard | Market Analysis, Charts & News.