





















Wednesday, July 8, 2026
No Result
View All Result
  • Home
  • Market Overview
    • All
    • Crude Oil Prices
    • Cryptocurrency News
    • Economy News
    • ETFs
    • Foreign Exchange News
    • Indices
    • Stock Market

    After a four-year U.S. ban, Polymarket mounts a major comeback campaign

    Oil jumps, risk assets fall as Trump threatens further strikes on Iran, says MOU is “dead”

    UBS Trigger Callable Notes linked to three indices

    With MSTR concerns assuaged, look to traditional signals around BTC

    Oil prices rise sharply after Iran launches attacks on tankers near strait of Hormuz | US-Israel war on Iran

    Amundi to turn disruptive technology ETF into memory chips fund

    • Crude Oil Prices
    • Cryptocurrency News
    • Economy News
    • ETFs
    • Indices
    • Stock Market
    • Foreign Exchange News
    • Commodities News
  • Forex Market
    • All
    • Central Banks News
    • Currencies
    • Interest Rate
    • Nonfarm Payroll

    Australian Dollar remains pressured amid Trump comments

    What we can learn from central bank investment plans

    Romania’s central bank holds interest rate at 6.5%

    British Pound slumps against US Dollar as risky assets turn fragile

    EUR/GBP Price Forecasts: Euro holds below 0.8450 with indicators showing some bullish divergence

    Tanzania central bank buys 28 tons of gold to diversify reserves

    The age of central bank divergence has arrived

    EUR/USD Price Forecast: Euro hesitates above 1.1400 as geopolitical risks mount

    Pound Awaits Tighter Policy from Bank of England

    • Central Banks News
    • Currencies
    • Interest Rate
    • Nonfarm Payroll
  • Commodities
    • All
    • Gold
    • Oil and Gas
    • Silver

    Adilet Party hosts talks on oil & gas industry development

    Gold and Silver Sink as Death of US-Iran MOU Sends Oil, Rates Jumping

    Oil prices jump as Trump declares Iran ceasefire ‘over.’ What about gas?

    Gold prices today, Wednesday, July 8, 2026: Gold prices falling following U.S.-Iran airstrikes

    Oil Prices Jump and These 3 Oil And Gas Stocks Stand Out

    Gold Price Today: Gold Falls 2.20% on July 08, 2026

    • Gold
    • Oil and Gas
    • Silver
  • Crypto
    • All
    • Bitcoin
    • Ethereum
    • Litecoin
    • Ripple
    • Solana
    • XRP

    Barclays Analyst Says Buy MSTR Stock Even as Strategy Sells Bitcoin

    ETH at $1,730: Down 65% With Its Biggest Upgrade Weeks Away

    Ripple Price Analysis: The Critical Level XRP Must Defend to Avoid Another Breakdown

    Cardano Founder Criticizes Ethereum’s Innovation Plan

    Cantor, Adam Back’s BSTR Seek New Terms for Bitcoin SPAC Merger

    Analyst revamps Coinbase on Bitcoin outlook

    • Bitcoin
    • Ethereum
    • Litecoin
    • Ripple
    • Solana
    • XRP
  • Charts
  • Economic Calendar
No Result
View All Result
Home Crypto

Ripple Price Forecast: XRP slides to $1.08 as demand cools

by MarketNewsBoard
7 hours ago
in Crypto, XRP
Share on FacebookShare on Twitter

Ripple (XRP) continues to trade under heavy selling, trading below $1.10 at the time of writing on Wednesday. The remittance token marks four consecutive days of declines,  weighed down by geopolitical tensions and significantly low risk appetite.

Capital outflows, weak on-chain activity keep XRP under pressure

XRP spot Exchange-Traded Funds (ETFs) activity remained muted on Tuesday and Monday, with no flows recorded, according to SoSoValue data. This muted activity suggests a withdrawal of demand rather than a complete loss of conviction in the digital asset. However, capital inflows remain pivotal in absorbing selling pressure and sustaining recoveries.

Cumulative inflows total $1.49 billion, with net assets under management at $1.02 billion, reinforcing investor long-term conviction in XRP.
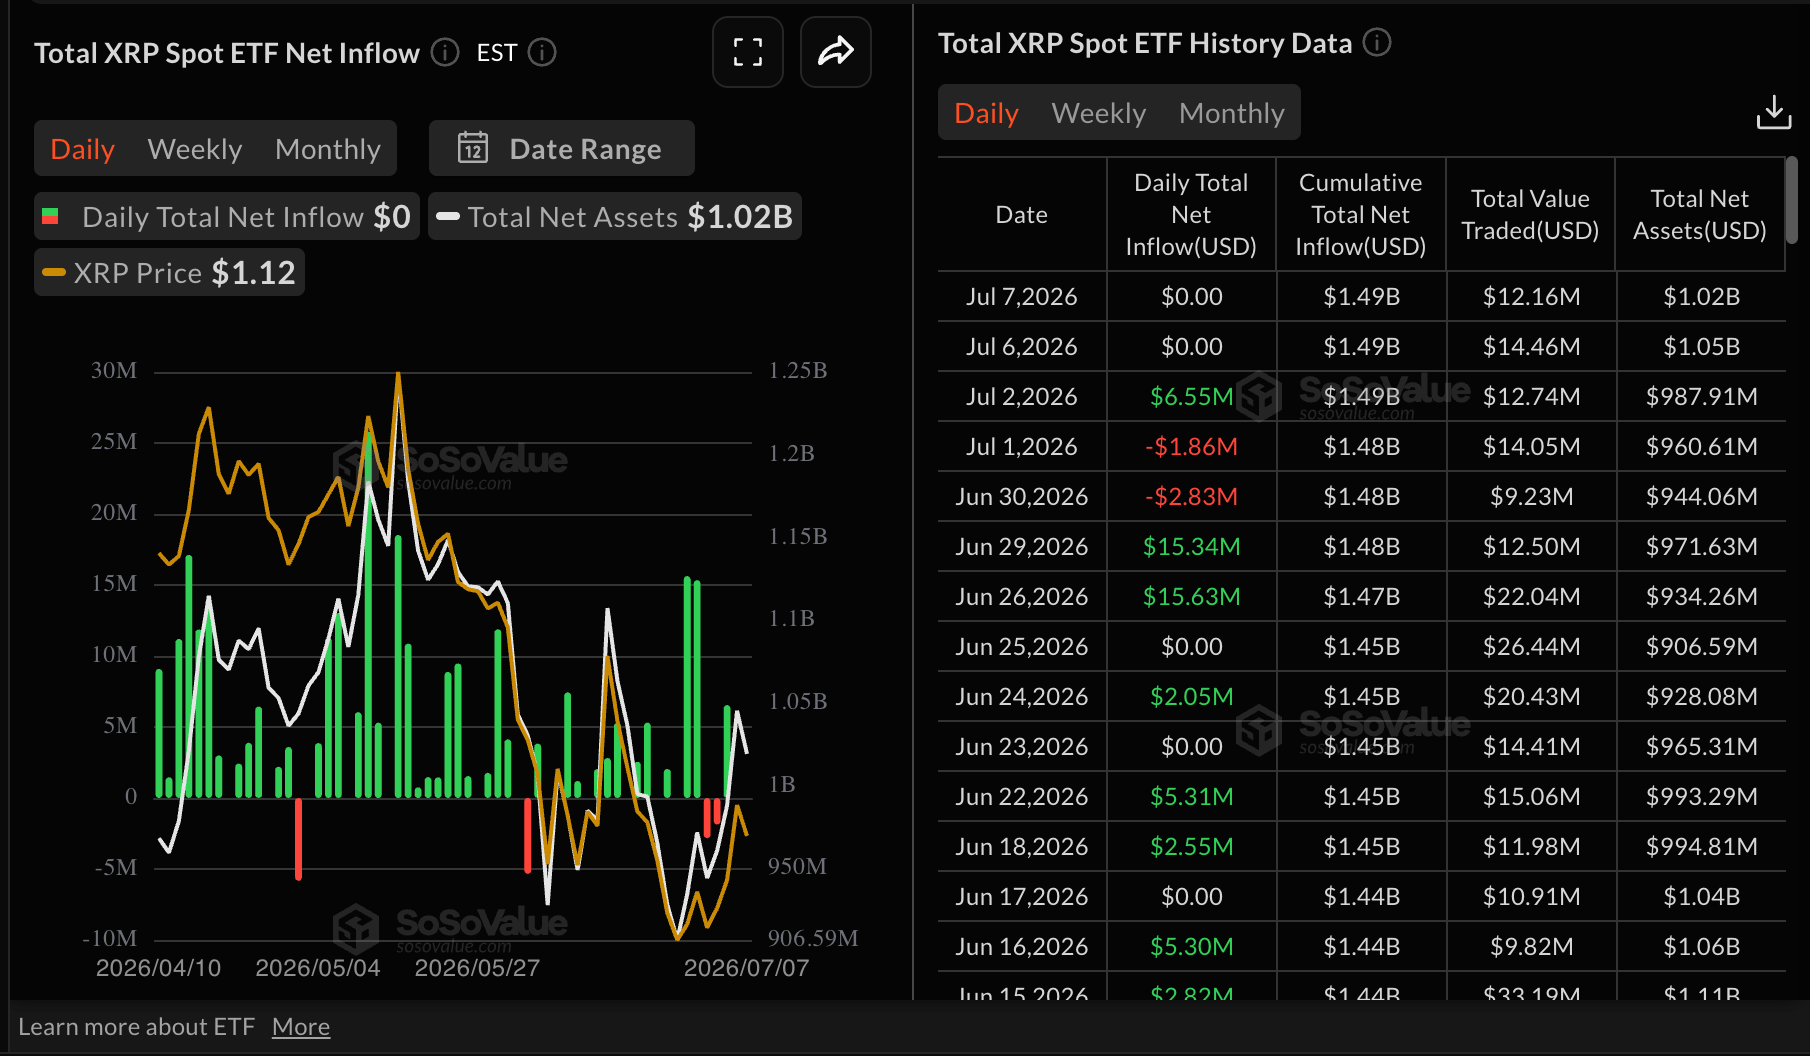
XRP ETF flows | Source : SoSoValue

On-chain activity is weakening, according to Santiment’s data, showing active addresses at 14,500 on Wednesday, down from roughly 31,000 the day before. A wider scope cements the decline, given that network users sending and receiving assets on the XRP Ledger (XRPL) peaked at 43,000 on June 30. If sustained, the low on-chain activity would continue to weigh on demand, further limiting XRP’s upside.
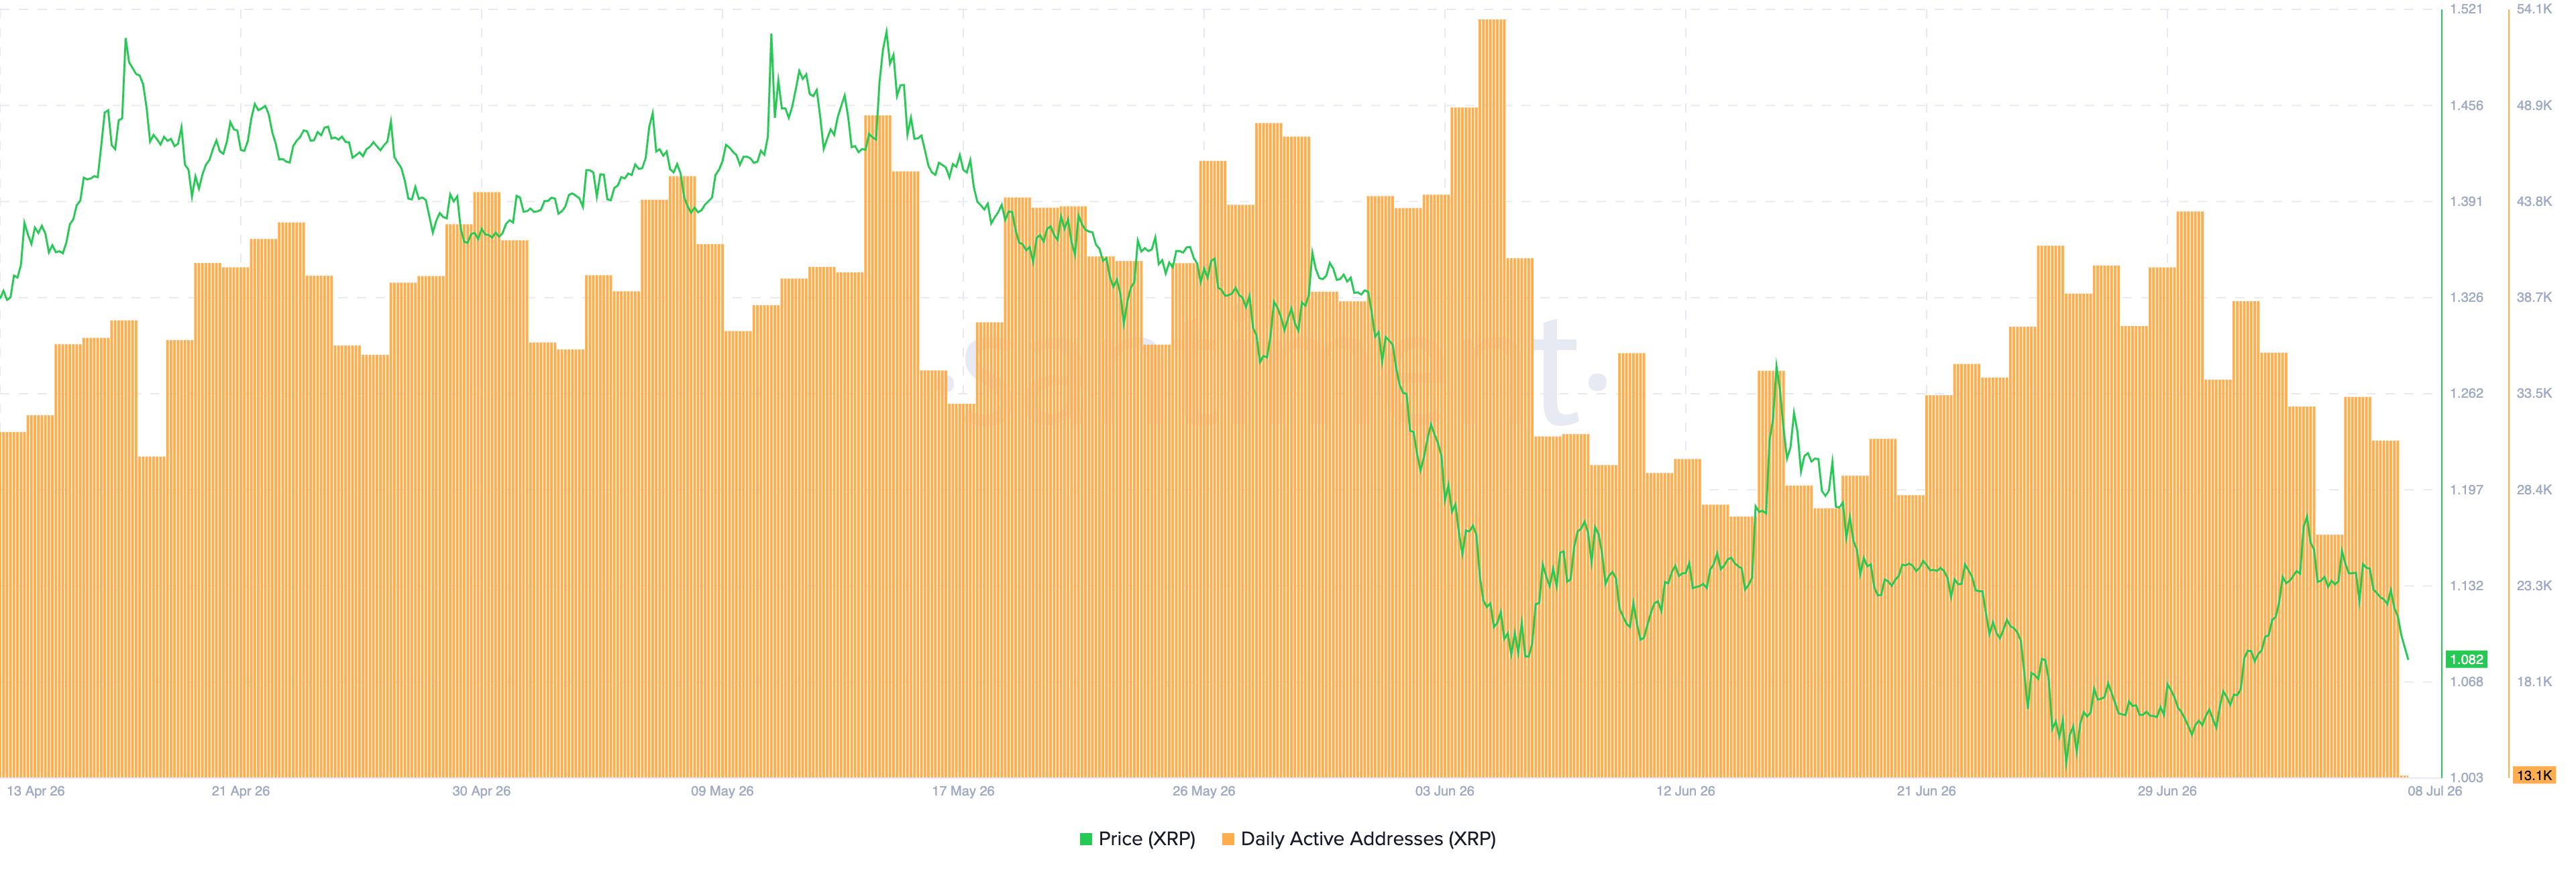
XRP Active Addresses | Source: Santiment

Retail demand for XRP is similarly suppressed, as futures Open Interest (OI) steadies at 213 billion XRP on Wednesday, up only marginally from 2.12 billion XRP the previous day. Nonetheless, CoinGlass data shows a gradual but sustained drop from 2.38 billion XRP on June 23, undermining investor appetite.
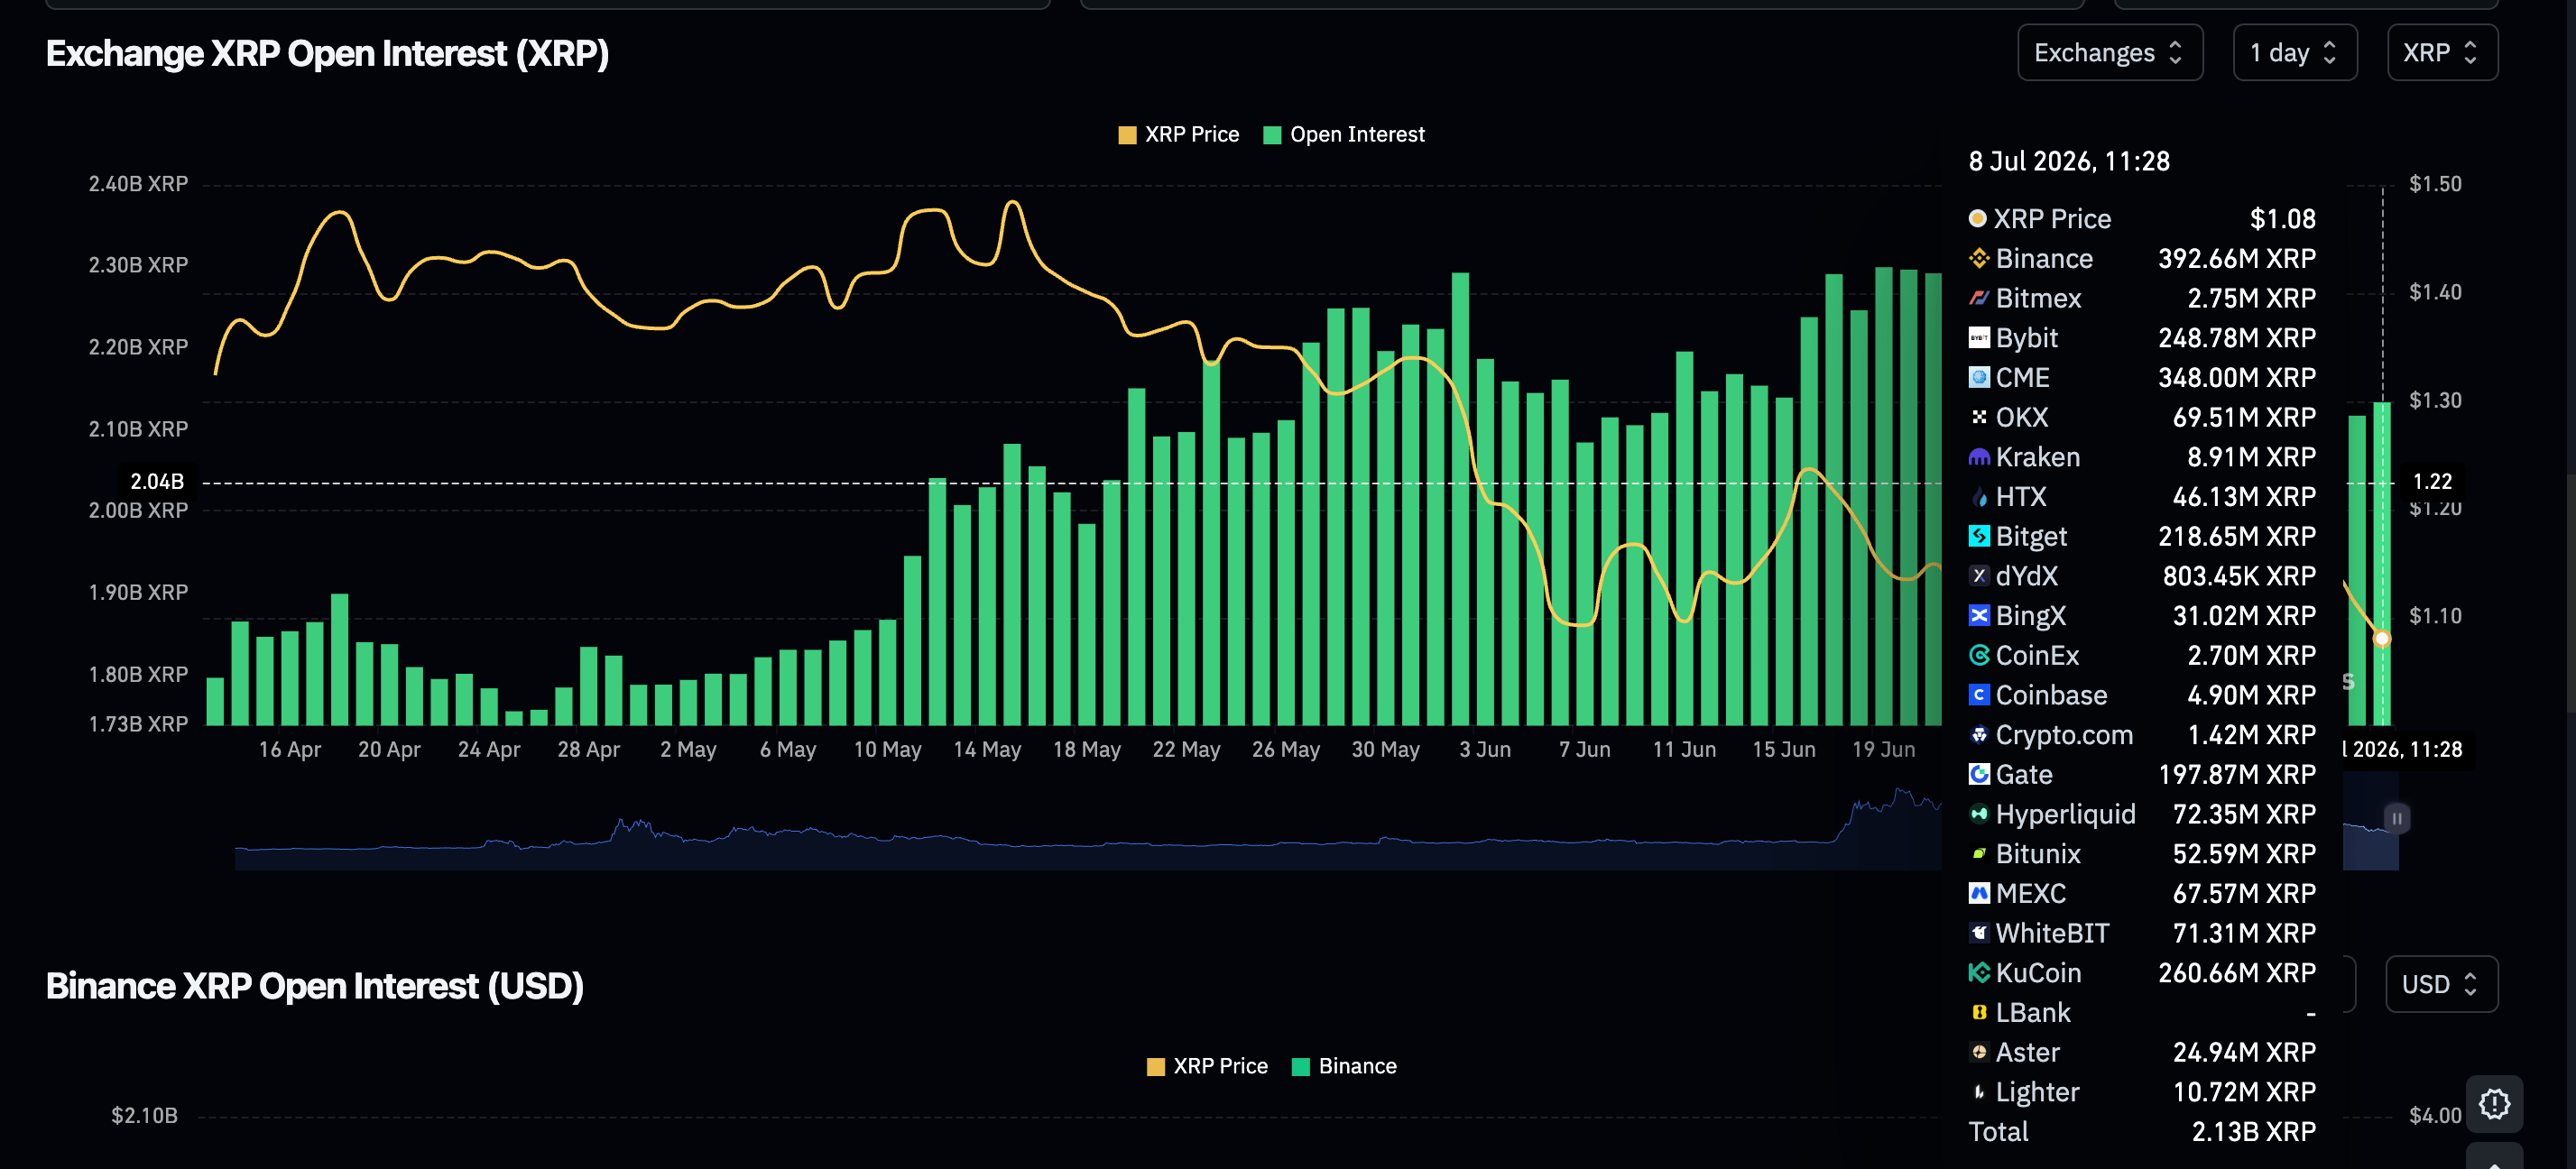
XRP Futures OI | Source: CoinGlass

Price analysis: XRP eyes short-term support at $1.05

XRP trades at $1.08, extending a corrective phase below its key Exponential Moving Averages. The 50-day EMA at $1.18, together with the 100-day EMA at $1.28 and the 200-day EMA at $1.49, sits overhead and suggests a capped, bearish near-term bias while price remains under this layered resistance zone.

The Moving Average Convergence Divergence (MACD) indicator edges in positive territory and hints at modest bullish momentum that has yet to challenge the dominant overhead structure on the daily chart. At the same time, Relative Strength Index (RSI) around 42 reinforces a consolidative tone rather than an immediate recovery.
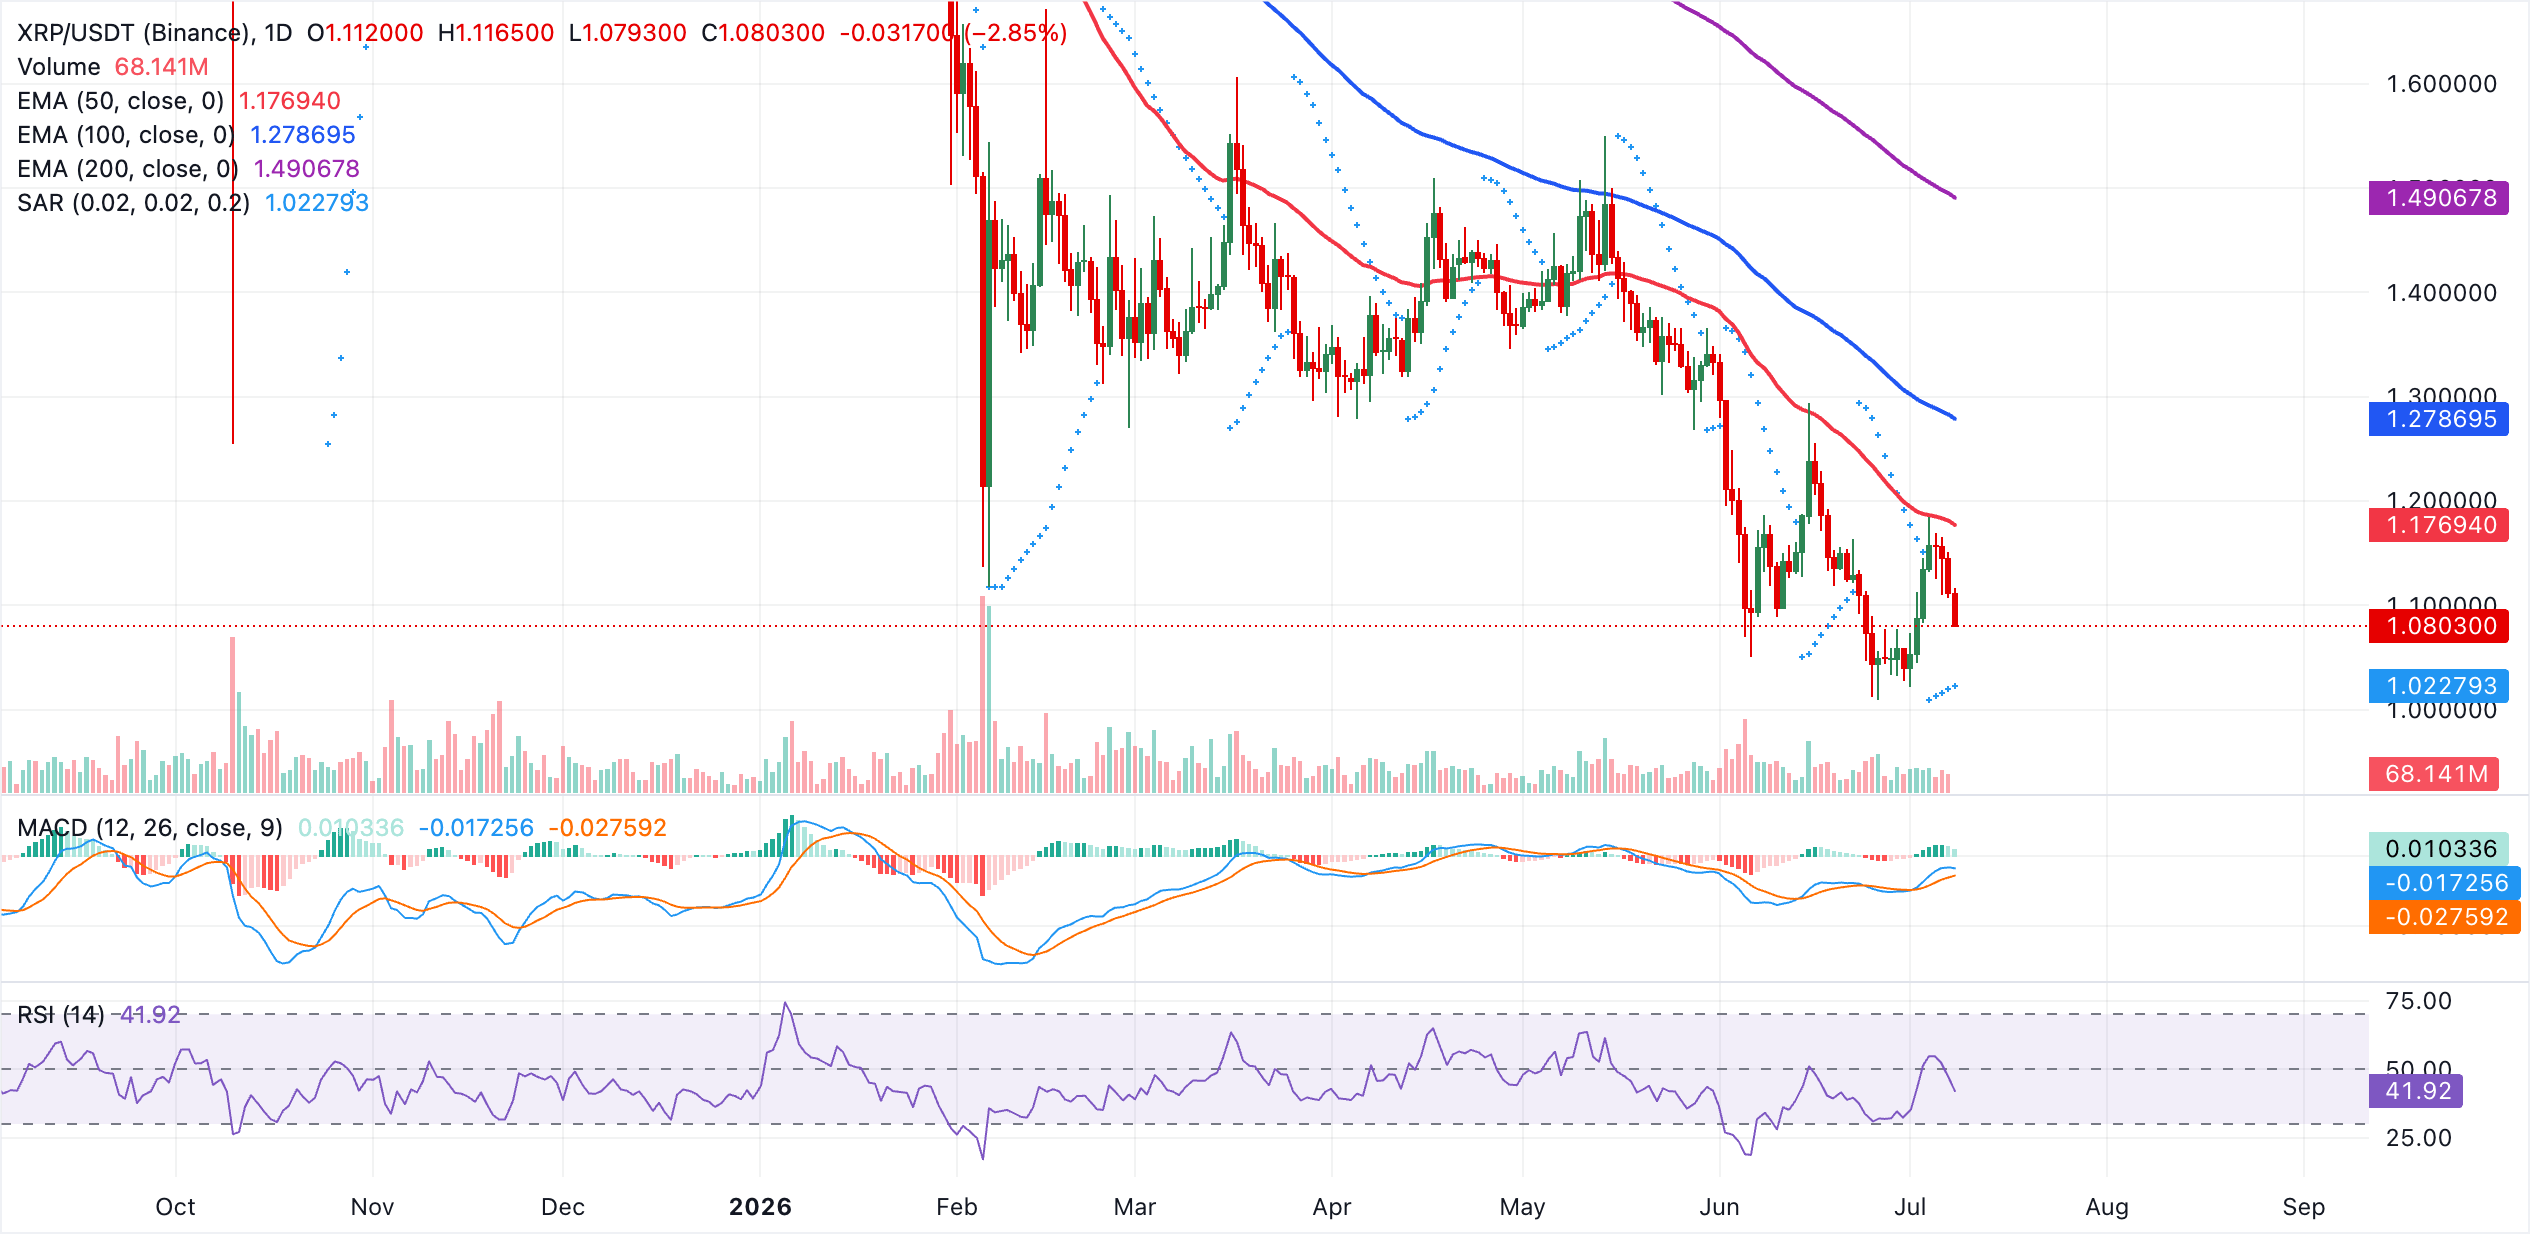
XRP/USDT daily chart

On the topside, initial resistance lies at the 50-day EMA around $1.18, and a sustained move above this level would expose the next barrier at the 100-day EMA near $1.28 before the broader bearish framework defined by the 200-day EMA at $1.49 comes into view. Looking down, the first notable support emerges at the Parabolic SAR level around $1.02, where a break lower would likely revive selling pressure and open the door to further declines. On the other hand, a defensive hold above this marker would allow bulls to keep probing the clustered EMA resistance overhead.

(The technical analysis of this story was written with the help of an AI tool. Know more.)

Crypto ETF FAQs

An Exchange-Traded Fund (ETF) is an investment vehicle or an index that tracks the price of an underlying asset. ETFs can not only track a single asset, but a group of assets and sectors. For example, a Bitcoin ETF tracks Bitcoin’s price. ETF is a tool used by investors to gain exposure to a certain asset.

Yes. The first Bitcoin futures ETF in the US was approved by the US Securities & Exchange Commission in October 2021. A total of seven Bitcoin futures ETFs have been approved, with more than 20 still waiting for the regulator’s permission. The SEC says that the cryptocurrency industry is new and subject to manipulation, which is why it has been delaying crypto-related futures ETFs for the last few years.

Yes. The SEC approved in January 2024 the listing and trading of several Bitcoin spot Exchange-Traded Funds, opening the door to institutional capital and mainstream investors to trade the main crypto currency. The decision was hailed by the industry as a game changer.

The main advantage of crypto ETFs is the possibility of gaining exposure to a cryptocurrency without ownership, reducing the risk and cost of holding the asset. Other pros are a lower learning curve and higher security for investors since ETFs take charge of securing the underlying asset holdings. As for the main drawbacks, the main one is that as an investor you can’t have direct ownership of the asset, or, as they say in crypto, “not your keys, not your coins.” Other disadvantages are higher costs associated with holding crypto since ETFs charge fees for active management. Finally, even though investing in ETFs reduces the risk of holding an asset, price swings in the underlying cryptocurrency are likely to be reflected in the investment vehicle too.

Source: Original Article

Previous Post

The age of central bank divergence has arrived

Next Post

Sterling today: Pound eases as Fed, oil-driven dollar bid weighs

RelatedPosts

Barclays Analyst Says Buy MSTR Stock Even as Strategy Sells Bitcoin

by MarketNewsBoard
2 hours ago

Barclays launches coverage on Strategy stock with an Overweight rating, days after the Bitcoin treasury company unveils its new financial framework. Source: Original Article

Read moreDetails

ETH at $1,730: Down 65% With Its Biggest Upgrade Weeks Away

by MarketNewsBoard
2 hours ago

Ethereum (ETH) trades near $1,730, a level last seen in March 2023, after losing 65% from its August 2025 all-time high. Meanwhile, its biggest upgrade...

Read moreDetails
Next Post

Sterling today: Pound eases as Fed, oil-driven dollar bid weighs

XRP Price Nears Make-or-Break Moment as Analysts Split Between Breakout and Breakdown

Recommended.

Bitcoin climbs above $63k as Fed rate hike fears ease

July 6, 2026

Ethereum (ETHUSD) Suddenly Goes down 1.22% on Jul 7: What You Need to Watch

July 7, 2026

Trending.

No Content Available
Market News Board | Market Analysis,Charts & News

MarketNewsBoard delivers trusted financial news, real-time market analysis, interactive charts, and economic insights across the global financial markets.

Covering Forex, Commodities, Stocks, Indices, Cryptocurrencies, and major economic events...

Follow Us

Market Overview

  • Forex Market
  • Commodities
  • Cryptocurrency News
  • Stocks
  • Indices
  • Crude Oil Prices
  • Economic Calendar

Resources

  • Central Banks News
  • Economy News
  • Interest Rate
  • Nonfarm Payroll
  • Charts

Tools

  • Currency Heat Map
  • Correlation Matrix
  • Market Sentiment
  • Currency Cross Rates
  • Crypto Rates
  • About Us
  • Contact Us
  • Disclaimer
  • Privacy Policy
  • Terms and Conditions

© 2026 MarketNewsBoard | Market Analysis, Charts & News.

AAPL
$311.45
AMZN
$241.13
BTC-USD
$61,734.49
EURUSD=X
$1.14
DX-Y.NYB
$101.18
NVDA
$199.07
TSLA
$393.11
DOW
$29.30
^N225
$66,819.05
JPY=X
$162.59
GBPUSD=X
$1.34
CAD=X
$1.42
NG=F
$3.24
BZ=F
$79.41
NFLX
$76.16
GOOG
$357.88
MSFT
$382.19
^RUT
$2,940.90
^FTSE
$10,489.04
AUDUSD=X
$0.692
CHF=X
$0.809
HG=F
$6.09
ETH=F
$1,733.50
No Result
View All Result
  • Home

© 2026 MarketNewsBoard | Market Analysis, Charts & News.