











Lithium periodic table element, mining, science, nature, innovation, chemical elements used in physics and other sciences
getty
Every year in early July, we update our interactive Periodic Table of Commodities Returns to reflect the performance of raw materials in the first six months of the year. Maybe I’m biased, but I believe it’s one of the clearest snapshots of the commodities landscape you’ll find anywhere.
And what a snapshot it is. Between a war in the Middle East, a tanker crisis in the Strait of Hormuz and gold’s wildest six months in recent memory, the first half of 2026 turned last year’s leaderboard on its head. Precious metals, which crushed the field in 2025, finished at the bottom of the table. Industrial and energy commodities led the way.
Lithium’s Redemption Story
A year ago, I pointed out that lithium, once the darling of the electric vehicle (EV) boom, had fallen nearly 19%, and I suggested contrarian investors keep an eye on it. Those who did have been rewarded. Lithium rose more than 22% in the first half, making it the top performer among the commodities we track.
What makes this rally different from the 2022 bubble is where the demand is coming from. EVs, the metal’s traditional driver, have cooled considerably. U.S. EV sales fell more than 20% year-over-year in the second quarter, according to Cox Automotive, as the expiration of federal tax credits continued to bite.
The slack is being picked up by stationary energy storage — specifically, the giant battery installations that stabilize power grids and keep artificial intelligence (AI) data centers humming around the clock. Demand for storage batteries surged 51% in 2025, roughly double the growth rate of EV batteries, and JPMorgan expects storage to account for 30% of global lithium demand this year, rising to 36% by 2030. Albemarle, the world’s largest producer, projects total demand will roughly double to 3.7 million tonnes by the end of the decade. This demand pillar barely existed during the last lithium rally.
The longer-term picture is even more dramatic. The United Nations (UN) trade body UNCTAD projects lithium demand to rise 353% between 2024 and 2040, with supply concentrated in a handful of countries and nearly 100 new export restrictions introduced since 2020. Resource nationalism of this kind, I believe, is one of the strongest long-term arguments for owning hard assets.
Demand for critical metals is set to surge, especially for lithium
U.S. Global Investors
Oil Rides the Hormuz Rollercoaster
Crude oil finished a close second, gaining about 21%. The U.S.-Iran conflict sent prices soaring and choked tanker traffic through the Strait of Hormuz, the narrow waterway that carries roughly a fifth of the world’s oil. The interim ceasefire brought dramatic relief — North Sea prices plunged $31 a barrel in June alone, according to the International Energy Agency (IEA) — but renewed exchanges of fire this week, and President Trump’s declaration that the ceasefire is over, have put a risk premium right back into the barrel.
A bright spot is that U.S. exports of crude oil and petroleum products hit an all-time record of 13.6 million barrels per day in April as global buyers turned to reliable American supply.
Domestic energy production has proven itself a strategic asset. Drivers have felt the volatility at the pump, though. The national average for regular gasoline peaked at $4.56 a gallon in May and, after weeks of easing, is climbing again at $3.84.
Copper and the AI Buildout
Copper posted a more modest 7% gain in the first half, but don’t let that fool you. The World Bank projects its metals and minerals price index will rise 17% in 2026 to an all-time high, with copper, aluminum and tin each expected to set record annual highs. BMO now sees copper averaging a record $6 per pound this year, citing stagnant mine supply and the widest concentrate deficits in years.
Loyal readers know I’ve been pounding the table on copper’s role in the AI revolution, and the research keeps getting stronger.
Bank of America estimates that AI infrastructure requires 60 to 75 tons of metals per megawatt of capacity, largely in power and cooling systems, with lead times for power equipment now stretching three to five years. Wood Mackenzie goes further, finding that once you count grid reinforcement and transmission, total metals consumption runs three to four times what the data center itself implies. The bottleneck, in other words, is the grid.
Gold: A Healthy Correction
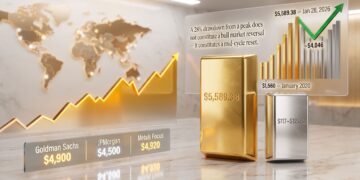
Gold entered 2026 red-hot following a 64% gain in 2025, its best year since 1979. It crossed above $5,500 an ounce intraday in January before profit-taking and the Iran shock dragged it below $4,000 by late June, leaving it down about 7% for the half. Silver fell 18%, while platinum and palladium, last year’s stars, brought up the rear.
I view this as a correction within a broader bull market, not the end of one. Even after the pullback, gold remains up roughly 25% from a year ago, and silver is up about 70%.
The structural drivers haven’t gone anywhere. Central banks purchased 863 tonnes of gold in 2025, absorbing nearly a quarter of annual mine production, and a record number of central bankers say they expect their own institutions to add to gold reserves over the next 12 months. After Washington and its allies froze Russian reserves in 2022, de-dollarization stopped being a theory and became policy. That hasn’t changed.
Global central bank gold purchases as a percent of mine production
U.S. Global Investors
Seasonality favors the bulls too. July has historically been the second-strongest month of the year for the yellow metal, averaging a 1.5% gain with positive returns 65% of the time over the past two decades. August is the strongest.
BMO forecasts gold reaching $4,800 by year-end and $5,000 in 2027 as Federal Reserve rate cuts draw nearer, while the World Gold Council (WGC) believes a clear catalyst — whether a shift in rate expectations or a fresh geopolitical shock — could lift the metal back toward $4,500 or above.
Positioning for the Second Half
If the first half of 2026 proved anything, it’s that commodities remain the world’s most geopolitically sensitive asset class, and one of its best portfolio diversifiers precisely for that reason. War repriced oil. AI repriced lithium and copper. And a 20% drawdown in gold left its long-term case, from central bank demand to Washington’s ever-growing debt load, fully intact.
Again, I invite you to explore the interactive Periodic Table of Commodities Returns, which makes it easy to compare commodity performance across years and sectors.
Source: Original Article