






















Tuesday, July 7, 2026
No Result
View All Result
  • Home
  • Market Overview
    • All
    • Crude Oil Prices
    • Cryptocurrency News
    • Economy News
    • ETFs
    • Foreign Exchange News
    • Indices
    • Stock Market

    Technical Analysis of US Crude, XAUUSD, and EURUSD for Today (July 7, 2026)

    Bitcoin holders can now participate in a BTC covered call income strategy on Binance

    Bitcoin’s (BTC) recent macro relief faces a challenge from Japanese interest rates

    Precious Metals bounce, Oil stays bearish and soft commodities push higher [Video]

    Is Strategy Still a Bitcoin Proxy?

    Live markets: Bitcoin and ether ETFs drew inflows Monday

    • Crude Oil Prices
    • Cryptocurrency News
    • Economy News
    • ETFs
    • Indices
    • Stock Market
    • Foreign Exchange News
    • Commodities News
  • Forex Market
    • All
    • Central Banks News
    • Currencies
    • Interest Rate
    • Nonfarm Payroll

    Market suggests lower rates in Poland compared to Czechia

    US Dollar Awaits FOMC Minutes. Forecast as of 07.07.2026

    Bye, forward guidance: How to trade when central banks choose silence

    United States Dollar Index holds below 101.00 as Fed hike bets fade

    China’s central bank unveils new measures to cement Hong Kong’s renminbi hub status

    GBP/USD Nears a Breakout as Buying Pressure Builds

    PBOC Unveils New Measures to Cement Hong Kong’s Yuan Hub Status

    USD CAD Chart & Rate – USD CAD Trading

    British Pound gains as easing Fed hike bets weigh on US Dollar

    • Central Banks News
    • Currencies
    • Interest Rate
    • Nonfarm Payroll
  • Commodities
    • All
    • Gold
    • Oil and Gas
    • Silver

    Gold prices fell, and so did Belarus's rainy day fund

    Shell flags ‘significantly higher’ gas trading to offset lower oil and gas production

    A Native American tribe once relied on oil and gas; now its desert land will help power Meta’s new data center

    Gold price prediction today: Will gold prices rise in the near-term? check July 7, 2026 outlook

    Saudi Arabia slices crude oil prices, but is it enough?

    Gold Rate Today, July 7: Check 18, 22 and 24 carat gold prices in Chennai, Mumbai, Delhi, Kolkata and other cities

    • Gold
    • Oil and Gas
    • Silver
  • Crypto
    • All
    • Bitcoin
    • Ethereum
    • Litecoin
    • Ripple
    • Solana
    • XRP

    Ethereum price setup turns bullish, but $1,800 still blocks rally

    Ripple Secures Full MiCA Approval for European Crypto Payments – Fintech Schweiz Digital Finance News

    Ripple executive says crypto is no fringe issue in Washington

    Ripple Wins Full MiCA License, Paving Way for Services Across the EEA

    Ripple and Stellar Outlook: Are XRP and XLM at a turning point?

    XRP price news: Why rally in Ripple-linked token stalled near $1.15

    • Bitcoin
    • Ethereum
    • Litecoin
    • Ripple
    • Solana
    • XRP
  • Charts
  • Economic Calendar
No Result
View All Result
Home Crypto

Ethereum price setup turns bullish, but $1,800 still blocks rally

by MarketNewsBoard
1 hour ago
in Crypto, Ethereum
Share on FacebookShare on Twitter

Ethereum traded near $1,777.49 at the time of writing, up 0.5% in the past 24 hours, according to crypto.news market data. 

Summary

  • Ethereum must close above $1,800 to strengthen the short-term bullish setup, analysts say.
  • Binance liquidity has improved, but rising exchange reserves still pose selling pressure near $2,000 resistance.
  • MACD and RSI support recovery, while $1,750 remains the key level for bullish invalidation.

The token had a 24-hour low of $1,732.10 and a high of $1,819.88, while daily trading volume stood near $17.08 billion.

The move kept ETH close to the $1,800 area, which traders now view as the main short-term resistance zone. The token has recovered from the sharp June selloff after buyers defended the $1,500 to $1,600 area.

The current setup has turned attention to a daily close above $1,800. Analysts say that level could decide whether ETH builds a stronger recovery or stays trapped in a range above $1,700.

Ethereum climbed about 12% from July 1 as weaker U.S. jobs data and renewed spot ETF inflows brought buyers back into the market. According to SoSoValue data, on July 6, Ethereum spot ETFs recorded a total net inflow of USD 29.082 million, led by BlackRock’s ETHA with USD 29.742 million in single-day net inflows. 
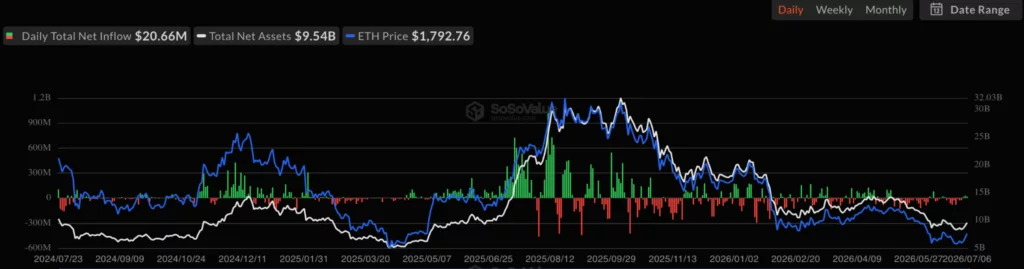
Ethereum Spot ETF Net Inflow, source: SoSoValue

Analysts watch $1,800 and $1,844

Analyst Ali Charts said Ethereum is testing the 0.8 MVRV Pricing Band near $1,796. He said the same area aligns with the TD Sequential resistance trendline, making it a key technical level for traders.

Ali said a daily close above $1,796, followed by a hold as support, would strengthen the bullish case. He added that a move through the TD risk line at $1,816 could open the way for a test of the channel resistance near $1,844.

“A break above both $1,796 and $1,816 could trigger a bullish breakout,” Ali said in his Ethereum setup. He placed Ethereum’s realized price target near $2,245 if buyers clear those levels and hold momentum.

ETHEREUM BULLISH TRIGGER: $1,800

Ethereum is currently testing the 0.8 MVRV Pricing Band at $1,796 as resistance.

A daily close above this level, followed by a successful hold as support, would strengthen the bullish case and could open the door for a move toward Ethereum’s… pic.twitter.com/Ya7YyEHGjB

— Ali Charts (@alicharts) July 6, 2026

Daan Crypto Trades also pointed to $1,800 as the level that matters most on the current timeframe. “If bulls can get a daily close over $1,800, that’d be the first sign of strength for me,” he said in an X post.

The lower level remains clear. Daan and Ali both pointed to $1,750 as the support that bulls must defend. A loss of that level would weaken the current setup and could return focus to the $1,700 area.

Indicators support short-term recovery

The ETH/USDT daily chart shows a recovery from the June low. ETH bounced from the $1,500 to $1,600 range and moved toward $1,800 before cooling slightly.

Momentum indicators support the rebound. The MACD histogram is positive near 31.83, while the MACD line sits near -4.67 and above the signal line near -36.50. This shows improving momentum, though the MACD line still needs to move above zero to confirm a stronger trend shift.
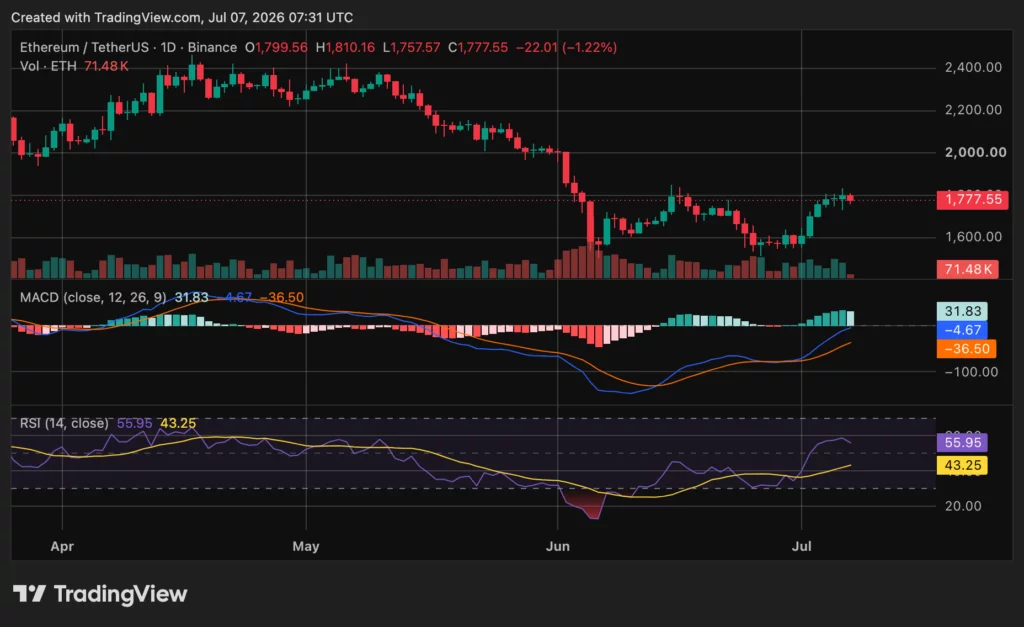
Ethereum (ETH) price chart, source: crypto.news

The RSI is also improving. It sits near 55.95, above its moving average near 43.25. That places RSI above the neutral 50 level, which shows buyers have short-term control without pushing the token into overbought territory.

As previously reported, Ethereum had already shown a rare TD buy signal while spot Ethereum ETF inflows returned. 

Binance liquidity improves, but reserves raise risk

On-chain data gives a mixed view. CryptoQuant analyst Arab Chain said the ETH Binance 30-day exchange liquidity ratio rose to about 5.22. The reading was based on about 20.32 million ETH in 30-day trading volume and around 3.8 million ETH in Binance reserves.

That means each ETH held on Binance turned over more than five times during the period. The reading points to active trading and better use of available exchange liquidity. It also suggests that Binance can support strong ETH trading activity without a large rise in reserves.

Still, rising exchange supply remains a risk. CryptoQuant analyst BorisD said Binance held about 3.893 million ETH, while Bitfinex held 2.2 million ETH, OKX held 1.18 million ETH, and Bybit held 314,000 ETH. He said ETH inflows into Binance and OKX could add selling pressure if demand fails to absorb the extra supply.

Moreover, Binance users had already increased their ETH balances by 10.17% to about 4.14 million ETH in its June proof-of-reserves snapshot. Larger user balances can reflect deposits, purchases, internal transfers, or account activity, so the data does not show one clear reason.

The next test sits near $1,800. A clean daily close above that level could push ETH toward $1,844, then $2,060 and $2,245. A rejection, or a break below $1,750, would keep Ethereum in a choppy range and raise the risk of another move toward $1,700.

Disclosure: This article does not represent investment advice. The content and materials featured on this page are for educational purposes only.

Source: Original Article

Previous Post

Bitcoin’s (BTC) recent macro relief faces a challenge from Japanese interest rates

Next Post

Market suggests lower rates in Poland compared to Czechia

RelatedPosts

Ripple Secures Full MiCA Approval for European Crypto Payments – Fintech Schweiz Digital Finance News

by MarketNewsBoard
2 hours ago

Free Newsletter Get the hottest Fintech Switzerland News once a month in your Inbox Ripple has secured full authorisation as a Crypto Asset Service Provider...

Read moreDetails

Ripple executive says crypto is no fringe issue in Washington

by MarketNewsBoard
3 hours ago

Ripple legal chief and National Cryptocurrency Association President Stuart Alderoty said Washington should stop treating crypto users as a small political group.  Summary Alderoty says...

Read moreDetails
Next Post

Market suggests lower rates in Poland compared to Czechia

Bitcoin holders can now participate in a BTC covered call income strategy on Binance

Recommended.

Oil price today: Crude slips after OPEC+ announces raising output targets from August

July 6, 2026

Oil Price Forecast: Supply Growth Limits WTI and Brent Rebound Outlook

July 7, 2026

Trending.

No Content Available
Market News Board | Market Analysis,Charts & News

MarketNewsBoard delivers trusted financial news, real-time market analysis, interactive charts, and economic insights across the global financial markets.

Covering Forex, Commodities, Stocks, Indices, Cryptocurrencies, and major economic events...

Follow Us

Market Overview

  • Forex Market
  • Commodities
  • Cryptocurrency News
  • Stocks
  • Indices
  • Crude Oil Prices
  • Economic Calendar

Resources

  • Central Banks News
  • Economy News
  • Interest Rate
  • Nonfarm Payroll
  • Charts

Tools

  • Currency Heat Map
  • Correlation Matrix
  • Market Sentiment
  • Currency Cross Rates
  • Crypto Rates
  • About Us
  • Contact Us
  • Disclaimer
  • Privacy Policy
  • Terms and Conditions

© 2026 MarketNewsBoard | Market Analysis, Charts & News.

AAPL
$312.66
AMZN
$244.16
BTC-USD
$63,018.81
EURUSD=X
$1.14
DX-Y.NYB
$100.92
NVDA
$195.55
TSLA
$419.77
DOW
$27.33
^N225
$68,256.96
JPY=X
$161.90
GBPUSD=X
$1.34
CAD=X
$1.42
NG=F
$3.29
BZ=F
$72.86
NFLX
$76.02
GOOG
$364.90
MSFT
$386.74
^RUT
$3,009.54
^FTSE
$10,700.09
AUDUSD=X
$0.694
CHF=X
$0.806
HG=F
$6.23
ETH=F
$1,773.50
No Result
View All Result
  • Home

© 2026 MarketNewsBoard | Market Analysis, Charts & News.