


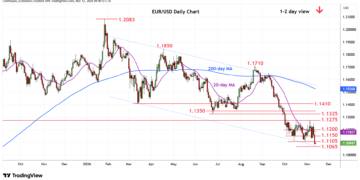






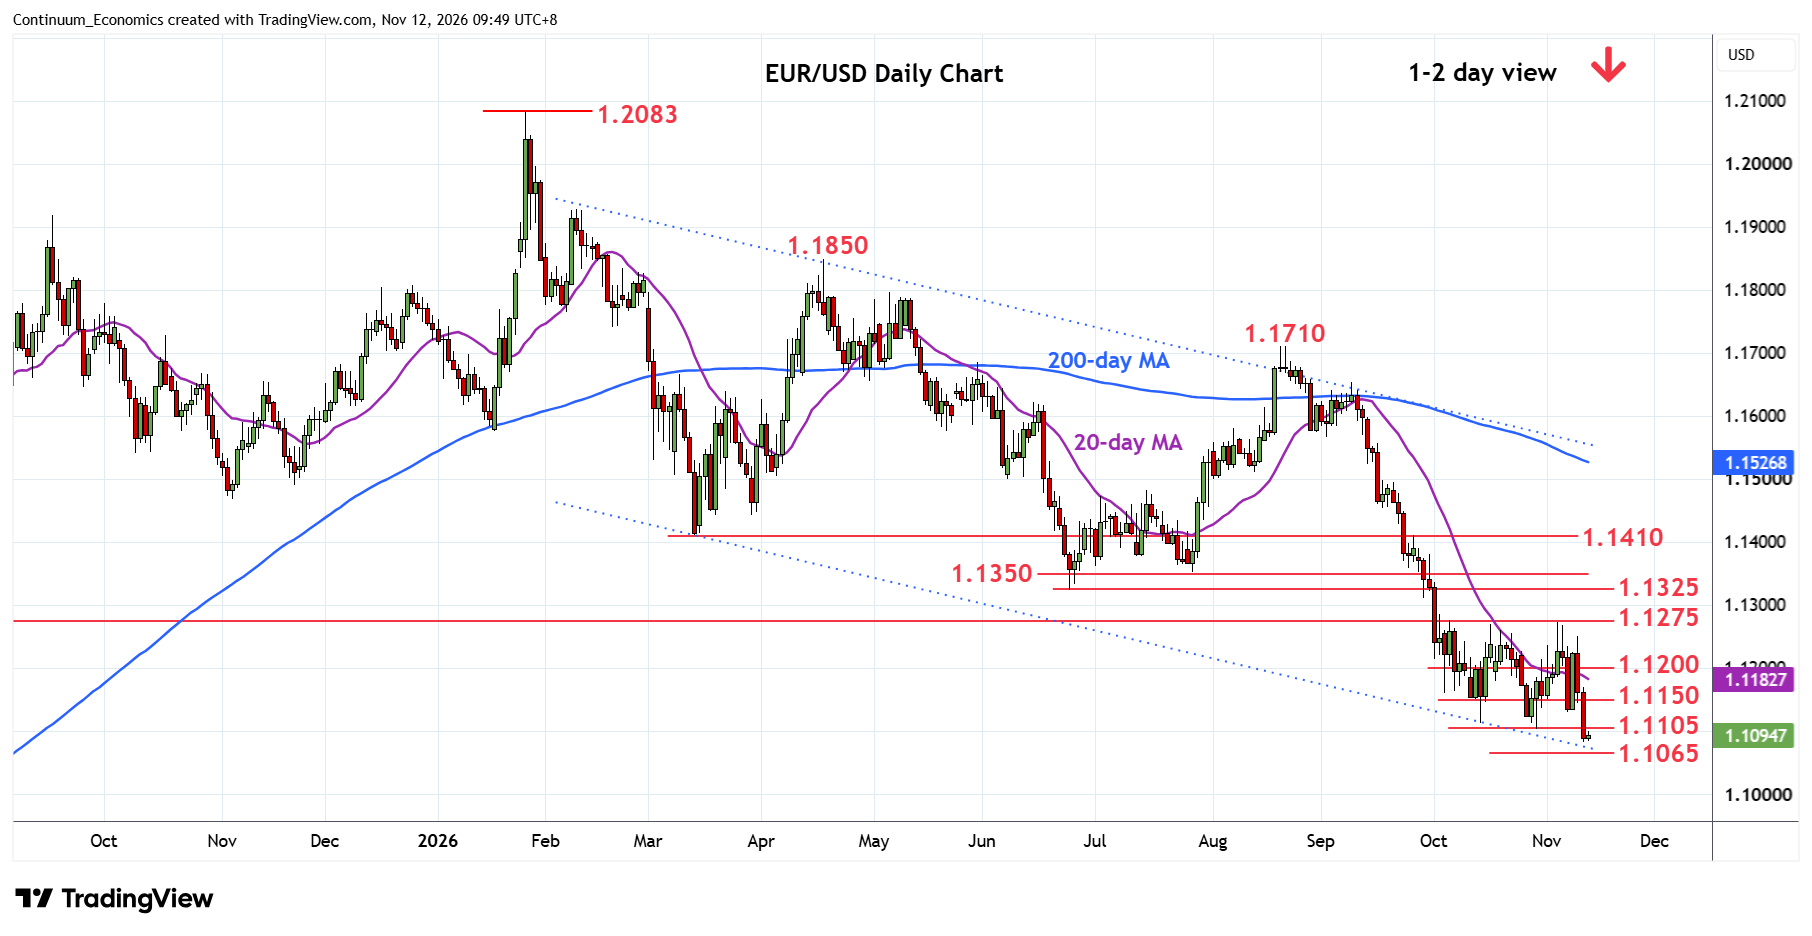
Under pressure as choppy trade within the October range area gives way to break of the 1.1105 low to extend losses from the January 2026 current year high
| Levels | Imp | Comment | Levels | Imp | Comment | |||
|---|---|---|---|---|---|---|---|---|
| R4 | 1.1325 | ** | Jun low | S1 | 1.1065 | * | May 2025 low | |
| R3 | 1.1275 | ** | 2023 year low | S2 | 1.1000 | ** | figure | |
| R2 | 1.1200 | * | congestion | S3 | 1.0955/50 | ** | Mar 2025 high, congestion | |
| R1 | 1.1150 | * | congestion | S4 | 1.0905 | * | 61.8% 2025/2026 rally |
Asterisk denotes strength of level
01:50 GMT – Under pressure as choppy trade within the October range area gives way to break of the 1.1105 low to extend losses from the January 2026 current year high. Negative daily and weekly studies suggest consolidation at ~1.1085 fresh year low see room to the 1.1065 support then the 1.1000 figure where reaction can be expected. Lower still, if seen, will see room to the 1.0955/50 area and 1.0905, 61.8% Fibonacci retracement. Meanwhile, resistance is lowered to the 1.1150/1.1200 congestion area which is expected to cap and sustain losses from the 1.1710 August swing high.
Source:
Original Article



 0.78%