





















Friday, July 10, 2026
No Result
View All Result
  • Home
  • Market Overview
    • All
    • Crude Oil Prices
    • Cryptocurrency News
    • Economy News
    • ETFs
    • Foreign Exchange News
    • Indices
    • Stock Market

    Soft CPI Unlikely to Fuel a Lasting Gold Rally

    Gas prices climbing again as U.S.-Iran tensions flare

    Baker Hughes total rig count +1 at 580

    Seagate Technology Holdings PLC Stock (STX) Moved Up by 3.30% on Jul 10: A Full Analysis

    Crude Oil Prices Rise, Gas Prices May Follow

    The Oil Trade Most Traders Are Getting Wrong in 2026

    • Crude Oil Prices
    • Cryptocurrency News
    • Economy News
    • ETFs
    • Indices
    • Stock Market
    • Foreign Exchange News
    • Commodities News
  • Forex Market
    • All
    • Central Banks News
    • Currencies
    • Interest Rate
    • Nonfarm Payroll

    U.S. Dollar Pulls Back As Traders Focus On Potential De-Escalation In The Middle East: Analysis For EUR/USD, GBP/USD, USD/CAD, USD/JPY

    German Stocks Slip As Oil Tests Central Banks’ Nerves

    AUD/USD climbs as Chinese Yuan strength supports the Aussie

    Turkey Central Bank Sees July Inflation as Key for Rate Outlook

    Ukraine unveils new bill as war drives demand for cash

    SoS! The overnight bilateral liquidity provision of non-bank financial institutions to banks

    GBP/JPY Price Forecast: Bulls remain in control with RSI and MACD in positive territory

    Czech Price Pressures Warrant Increased Caution for Central Bank

    Bank of England Warns of Escalating AI, Cyber & Market Risk

    • Central Banks News
    • Currencies
    • Interest Rate
    • Nonfarm Payroll
  • Commodities
    • All
    • Gold
    • Oil and Gas
    • Silver

    Oil And Gas Refiners Stocks Investors Are Watching As Fuel Supply Tightens

    Magnolia Oil And Gas Eyes A Record Q2 Cash Flow

    Crude Oil Prices Slide as President Trump Said Iran Peace Talks to Continue

    UBS Adjusts Price Target on Magnolia Oil & Gas to $34 From $38, Maintains Buy Rating

    US stocks and crude oil prices drift to a quiet finish of a bumpy week

    Gold Price Today on July 10, 2026

    • Gold
    • Oil and Gas
    • Silver
  • Crypto
    • All
    • Bitcoin
    • Ethereum
    • Litecoin
    • Ripple
    • Solana
    • XRP

    New Hampshire killed its landmark $100 million bitcoin bond

    Cambridge research reveals 31% of Ethereum node activity concentrated in the US

    Ethereum Price Analysis: ETH Faces a Crucial Test After Latest Rebound

    Metaplanet Announces Joint Study To Bring Bitcoin-Backed Digital Credit To Japan

    Ethereum must move faster or risk losing its edge says Starkware Founder

    Best Ethereum Staking Platforms in 2026

    • Bitcoin
    • Ethereum
    • Litecoin
    • Ripple
    • Solana
    • XRP
  • Charts
  • Economic Calendar
No Result
View All Result
Home Crypto

Ethereum Price Analysis: ETH Faces a Crucial Test After Latest Rebound

by MarketNewsBoard
3 hours ago
in Crypto, Ethereum
Share on FacebookShare on Twitter

Ethereum has staged a notable recovery after defending its recent lows, with buyers gradually rebuilding momentum. While the higher time frames remain constrained beneath major resistance, the lower time frame structure has improved, and on-chain activity appears to be stabilizing following months of cooling network participation.

Ethereum Price Analysis: The Daily Chart

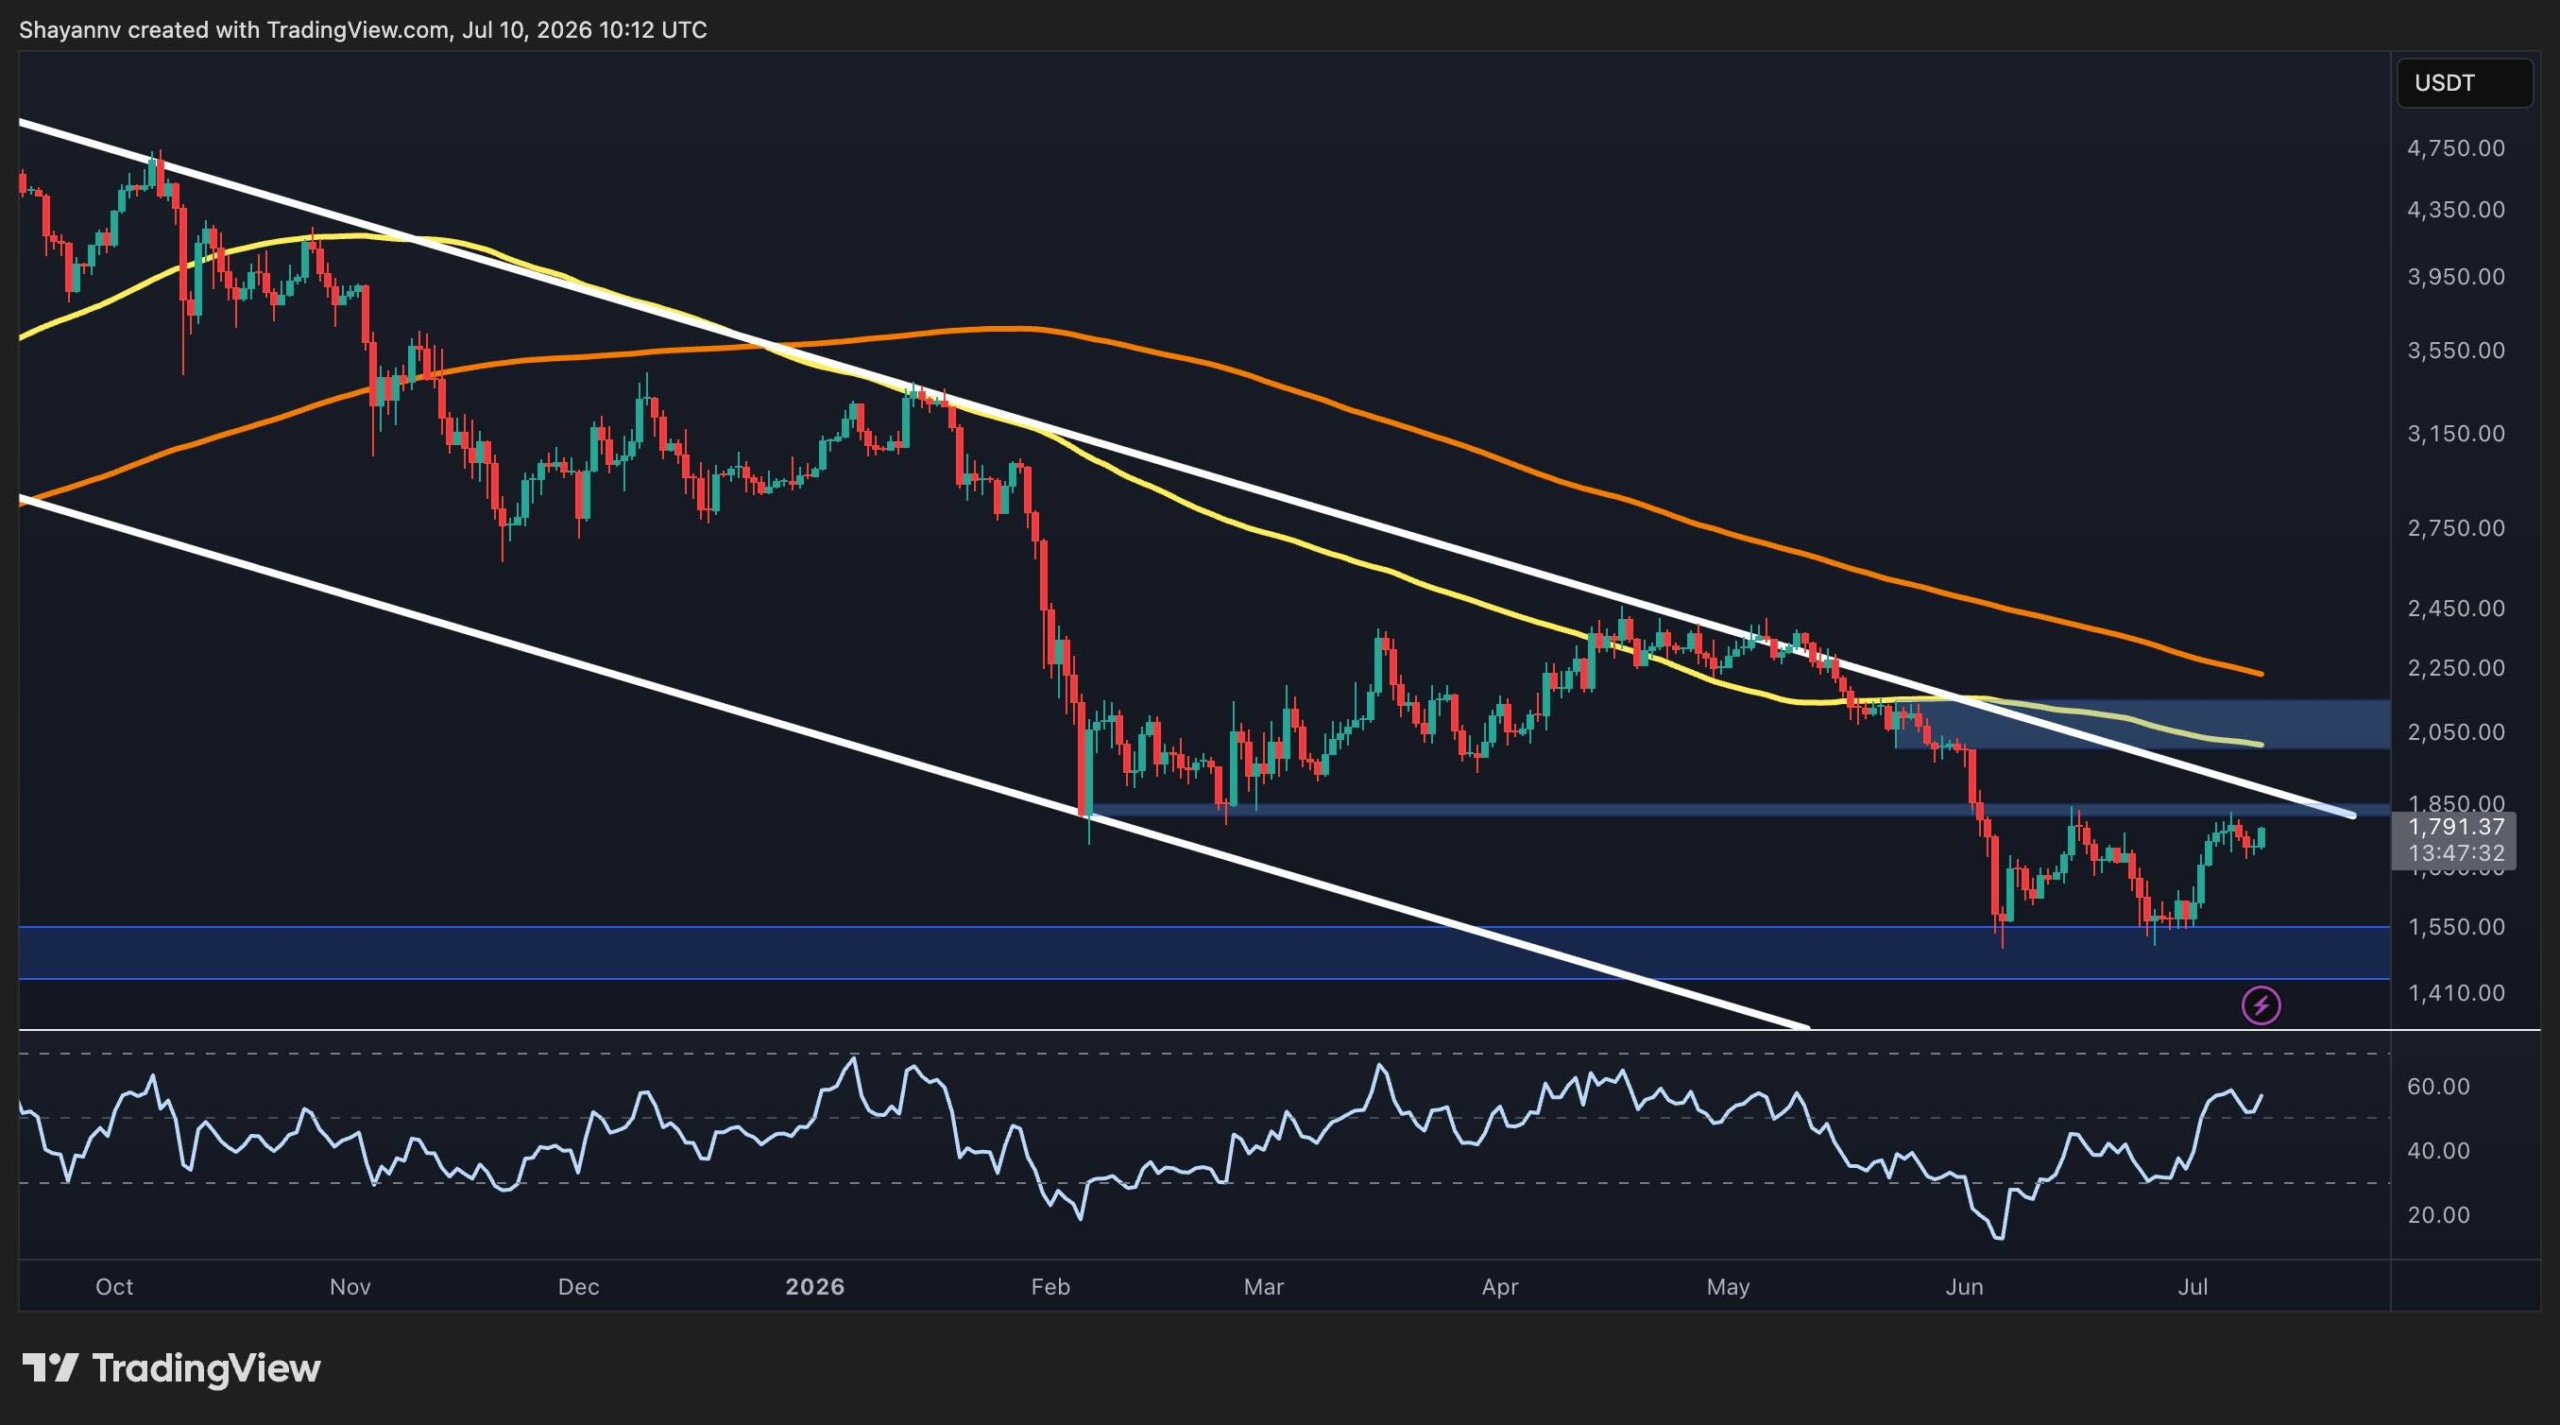
On the daily chart, it is evident that ETH continues to trade within a broader bearish structure despite its recent rebound. The asset remains inside the descending channel that has guided the market lower for several months, while both the 100-day and 200-day moving averages continue to slope downward above the current price, which reinforces the fact that the dominant trend is bearish.

Following the sharp decline toward the $1.5K demand zone, buyers stepped in aggressively, triggering a relief rally back toward the key resistance around $1.8K. This area is particularly important as it coincides with the descending channel’s upper trendline, making it a significant confluence resistance.

The RSI has recovered above the midline after previously entering oversold territory, suggesting bullish momentum has improved. However, the indicator has yet to reach overbought conditions, leaving room for additional upside if resistance is broken.

A decisive daily close above the $1.8K resistance could expose the next supply zone around $2.0K to $2.2K, where previous support has turned into resistance. Conversely, rejection from the current area would likely shift attention back toward the $1.5K support, with a loss of that level increasing the probability of another move toward much lower targets.
ETH/USDT 4-Hour Chart

The 4-hour frame presents a more constructive picture. Ethereum has established a clear higher low following its breakout from the recent consolidation range above $1.5k, which suggests that buyers have regained short-term control.

The highlighted higher low around the $1.75K region has so far been confirmed, indicating improving market structure. The price is now approaching the $1.8K to $1.85K resistance area, which has capped previous recovery attempts in recent weeks.

Momentum has also strengthened, with the RSI climbing back above the neutral 50 level after cooling from earlier highs. This suggests buying pressure remains intact, although resistance overhead could still trigger temporary consolidation.

As long as ETH continues holding above the $1.7K higher-low region, the short-term bullish structure remains valid. A successful breakout above $1.85K would strengthen the case for an extension toward the $2.K to $2.2K supply zone. Failure to maintain the higher low, however, would invalidate the recent recovery structure and shift focus back toward the $1.64K order block, and even the $1.5k critical rebound zone.

On-Chain Analysis

Ethereum’s Active Addresses metric continues to trend lower after peaking earlier in the year. The 30-day EMA of active addresses has been steadily declining, indicating that network participation has cooled significantly compared to previous highs.

Despite this longer-term downtrend in activity, the pace of the decline appears to be moderating, suggesting the network may be entering a stabilization phase rather than experiencing continued deterioration. Historically, periods where active addresses stabilize after prolonged weakness have often coincided with price consolidation before the next major directional move.

At the same time, ETH has managed to recover from its recent lows while active address growth remains subdued. This divergence implies that the current rebound has been driven more by improving market sentiment and positioning than by a broad resurgence in on-chain demand.

For the recovery to evolve into a more sustainable bullish trend, a gradual increase in active addresses alongside continued price appreciation would provide stronger confirmation that capital and user activity are returning to the Ethereum network. Until then, the improving technical structure should be viewed alongside still-muted on-chain participation, suggesting cautious optimism rather than confirmation of a full trend reversal.

SPECIAL OFFER (Exclusive)

LIMITED OFFER for CryptoPotato readers at Bybit: Use this link to register and open a $500 FREE position on any coin!

Disclaimer: Information found on CryptoPotato is those of writers quoted. It does not represent the opinions of CryptoPotato on whether to buy, sell, or hold any investments. You are advised to conduct your own research before making any investment decisions. Use provided information at your own risk. See Disclaimer for more information.

Source: Original Article

Previous Post

AI Agent Security Boosts Okta Shares

Next Post

Crude Oil Prices Slide as President Trump Said Iran Peace Talks to Continue

RelatedPosts

New Hampshire killed its landmark $100 million bitcoin bond

by MarketNewsBoard
1 hour ago

Scott Melker discusses how New Hampshire officials rejected the state's proposal for a bitcoin-backed (BTC-USD) state bond. "The Daily Wolf with Scott Melker" airs every...

Read moreDetails

Cambridge research reveals 31% of Ethereum node activity concentrated in the US

by MarketNewsBoard
2 hours ago

Ethereum likes to bill itself as the world’s decentralized computer. But according to research from the Cambridge Centre for Alternative Finance (CCAF), nearly a third...

Read moreDetails
Next Post

Crude Oil Prices Slide as President Trump Said Iran Peace Talks to Continue

U.S. stocks and crude oil prices drift to a quiet finish of a bumpy week

Recommended.

Does Teradyne’s (TER) Shift Into Growth Indices Recast Its Core AI and Robotics Narrative?

July 8, 2026

AngelList ends crypto funding support tied to Ripple’s Rail

July 8, 2026

Trending.

No Content Available
Market News Board | Market Analysis,Charts & News

MarketNewsBoard delivers trusted financial news, real-time market analysis, interactive charts, and economic insights across the global financial markets.

Covering Forex, Commodities, Stocks, Indices, Cryptocurrencies, and major economic events...

Follow Us

Market Overview

  • Forex Market
  • Commodities
  • Cryptocurrency News
  • Stocks
  • Indices
  • Crude Oil Prices
  • Economic Calendar

Resources

  • Central Banks News
  • Economy News
  • Interest Rate
  • Nonfarm Payroll
  • Charts

Tools

  • Currency Heat Map
  • Correlation Matrix
  • Market Sentiment
  • Currency Cross Rates
  • Crypto Rates
  • About Us
  • Contact Us
  • Disclaimer
  • Privacy Policy
  • Terms and Conditions

© 2026 MarketNewsBoard | Market Analysis, Charts & News.

AAPL
$314.83
AMZN
$245.58
BTC-USD
$63,864.39
EURUSD=X
$1.14
DX-Y.NYB
$100.95
NVDA
$210.26
TSLA
$409.33
DOW
$28.98
^N225
$68,557.73
JPY=X
$161.69
GBPUSD=X
$1.34
CAD=X
$1.41
NG=F
$2.94
BZ=F
$76.04
NFLX
$73.41
GOOG
$353.43
MSFT
$385.06
^RUT
$2,982.49
^FTSE
$10,497.29
AUDUSD=X
$0.695
CHF=X
$0.809
HG=F
$6.28
ETH=F
$1,793.00
No Result
View All Result
  • Home

© 2026 MarketNewsBoard | Market Analysis, Charts & News.