














Wednesday, July 8, 2026
No Result
View All Result
  • Home
  • Market Overview
    • All
    • Crude Oil Prices
    • Cryptocurrency News
    • Economy News
    • ETFs
    • Foreign Exchange News
    • Indices
    • Stock Market

    Bitcoin Price Forecast: New Bombings on Iran Could Plunge BTC to $50K

    Conagra Brands (CAG) Joins Russell Indices, Is It Still 4% Undervalued?

    Iran tensions add fresh uncertainty to the global economy : NPR

    Citi Names Top Life Science Tools & Diagnostics Stocks for Second Half

    (FCUD.U) Market Performance Analysis

    Clatsop County news briefs for July 9, 2026

    • Crude Oil Prices
    • Cryptocurrency News
    • Economy News
    • ETFs
    • Indices
    • Stock Market
    • Foreign Exchange News
    • Commodities News
  • Forex Market
    • All
    • Central Banks News
    • Currencies
    • Interest Rate
    • Nonfarm Payroll

    Fed’s Balancing Act: Inflation Concerns and Rate Decision

    U.S. Dollar Gains Ground Amid Rally In The Oil Markets: Analysis For EUR/USD, GBP/USD, USD/CAD, USD/JPY

    Canadian Dollar strengthens on Oil rally as Fed, jobs data loom

    The IMF hopes to engage on central banks’ changes to forward guidance

    IMF says hopes to engage on central banks’ changes to forward guidance

    Australian Dollar remains pressured amid Trump comments

    What we can learn from central bank investment plans

    Romania’s central bank holds interest rate at 6.5%

    British Pound slumps against US Dollar as risky assets turn fragile

    • Central Banks News
    • Currencies
    • Interest Rate
    • Nonfarm Payroll
  • Commodities
    • All
    • Gold
    • Oil and Gas
    • Silver

    Oil prices jump over 7% as Iran ceasefire declared ‘Over’

    Magnolia Oil & Gas (MGY) Rises With Oil Prices, Is It Still Trading At A Discount?

    Adilet Party hosts talks on oil & gas industry development

    EZCORP Stock to Watch as Pawn Demand and Gold Prices Lift Profit

    Gold and Silver Sink as Death of US-Iran MOU Sends Oil, Rates Jumping

    Oil prices jump as Trump declares Iran ceasefire ‘over.’ What about gas?

    • Gold
    • Oil and Gas
    • Silver
  • Crypto
    • All
    • Bitcoin
    • Ethereum
    • Litecoin
    • Ripple
    • Solana
    • XRP

    Best Solana meme coins to watch as July rally builds

    ETHA vs. IBIT: Does Ethereum or Bitcoin Belong in Your Portfolio?

    Barclays Analyst Says Buy MSTR Stock Even as Strategy Sells Bitcoin

    ETH at $1,730: Down 65% With Its Biggest Upgrade Weeks Away

    Ripple Price Analysis: The Critical Level XRP Must Defend to Avoid Another Breakdown

    Cardano Founder Criticizes Ethereum’s Innovation Plan

    • Bitcoin
    • Ethereum
    • Litecoin
    • Ripple
    • Solana
    • XRP
  • Charts
  • Economic Calendar
No Result
View All Result
Home Crypto

Solana Price Prediction: Can SOL Hold the 100-Day EMA After Its Busiest Week on Record?

by MarketNewsBoard
1 day ago
in Crypto, Solana
Share on FacebookShare on Twitter

Solana trades at $81.49 on July 7, down 0.49%, pressing directly against the 100-day EMA as the network posts its busiest week on record.

Is $SOL Holding Or Losing The 100-Day EMA?
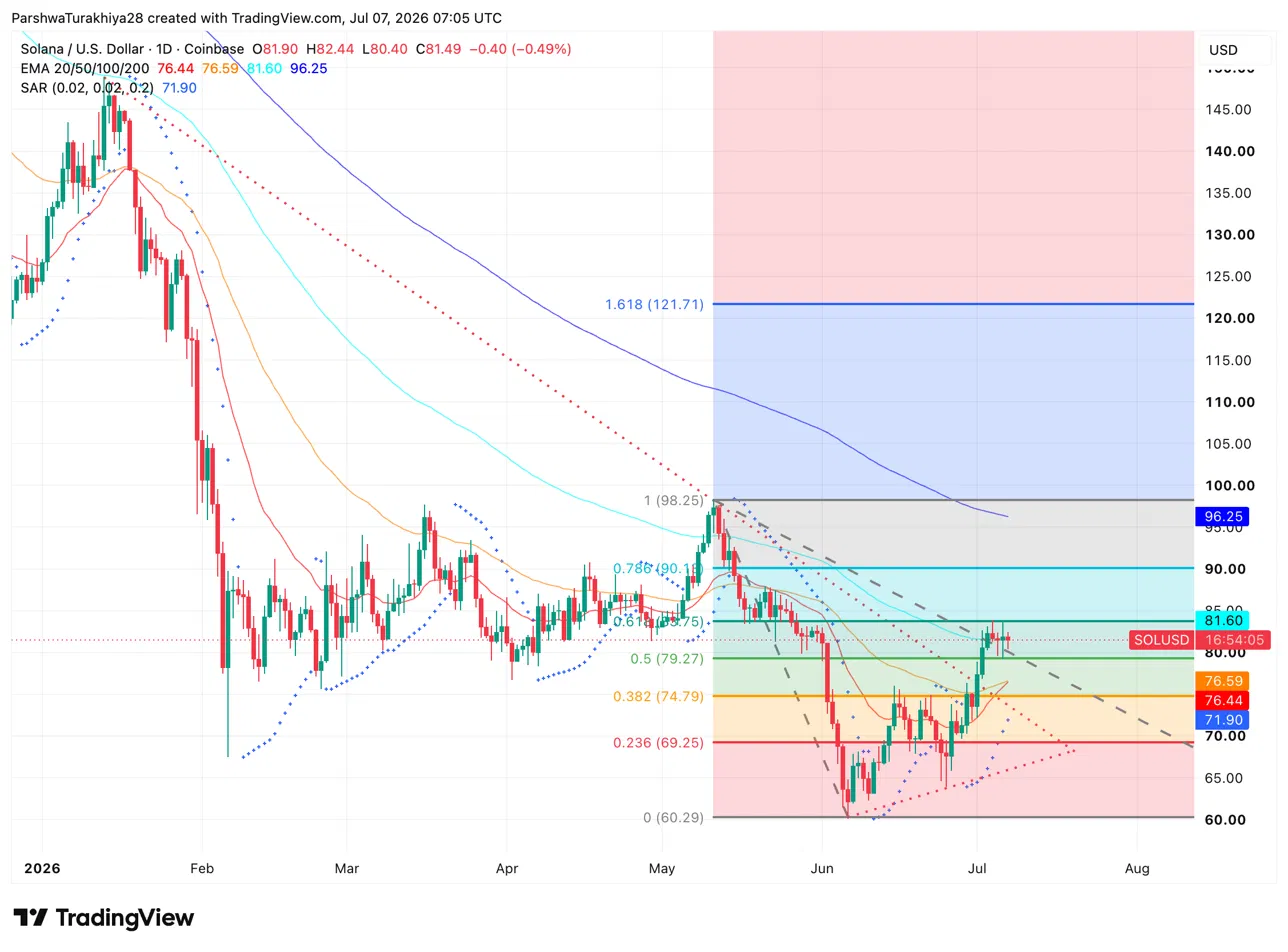
$SOL 1D Price Action (Source: TradingView)

The daily chart shows $SOL sitting right at the 100-day EMA at $81.60, a level that hasn’t been tested from below since the June breakdown. Price bounced off the $60.29 low and has worked through several Fibonacci retracement levels, clearing the 0.5 level at $79.27 and now pressing against the 0.618 at $83.75 as the next hurdle. The Parabolic SAR at $71.90 sits well below price, confirming the short-term recovery trend remains intact.

The 20-day and 50-day EMAs at $76.44 and $76.59 are now both below spot, having been reclaimed during the July recovery, which is the first time $SOL has traded above both simultaneously since May. The 200-day EMA at $96.25 and the 0.786 Fibonacci level at $90.18 mark the heavier resistance zones above.

What Are The Key Support And Resistance Levels For $SOL Today?

  • Support at $79.27 on the 0.5 Fib and $76.44 on the 20-day EMA
  • Resistance at $83.75 on the 0.618 Fib, then $90.18 on the 0.786 Fib

What Do $SOL Derivatives Show About Current Positioning?
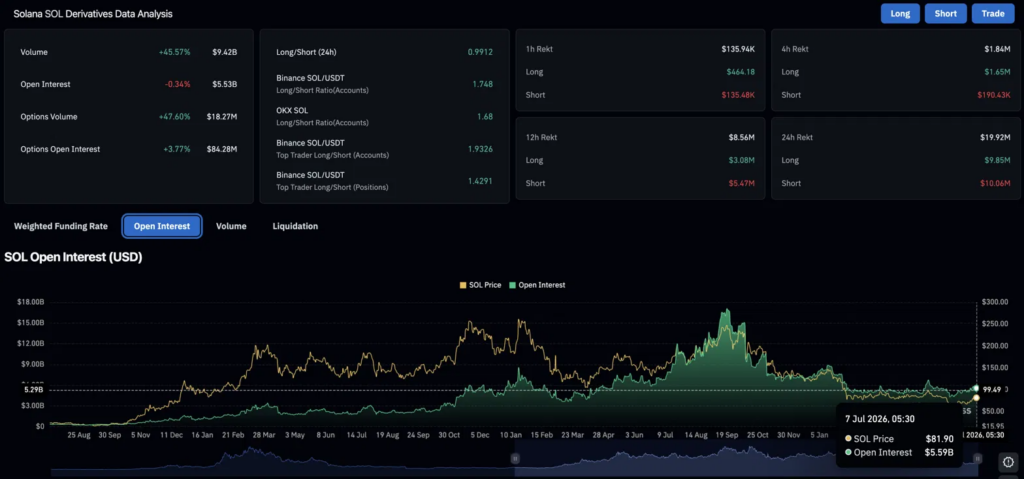
$SOL Derivative Analysis (Source: Coinglass)

Volume jumped 45.57% to $9.42B while open interest barely moved, slipping 0.34% to $5.53B. That gap between volume and OI tells you traders are actively repositioning rather than stacking up new leveraged bets. Options volume also spiked 47.60% to $18.27M, meaning a growing number of participants are using options to hedge or take directional views rather than going straight through perpetuals.

The liquidation picture over the past 24 hours is about as balanced as it gets. Shorts lost $10.06M, longs lost $9.85M. Neither side took a real beating, which is actually unusual. It tells you the market is genuinely split on where $SOL goes next from the $81 level, and no clear conviction trade has emerged yet.

Why Did Solana Just Hit A Transaction Record?

🚨BREAKING: @Solana’s weekly transaction activity hit a new all-time high, with 1B+ non-vote transactions processed last week. pic.twitter.com/x3GBDFHO6Q

— SolanaFloor (@SolanaFloor) July 6, 2026

Solana processed over one billion non-vote transactions in a single week for the first time, according to SolanaFloor. Non-vote transactions are the ones that actually matter for measuring real usage, covering activity from users, applications and traders rather than the background validator voting process. A spike of this size at the start of July points to a sharp pickup in ecosystem activity rather than a gradual trend.

📈DATA: In just two weeks, @Solana’s weekly active users surged from 16.8 million to 29.7 million, an increase of 12.9 million wallets (+76.8%). pic.twitter.com/bbHWaJfitL

— SolanaFloor (@SolanaFloor) July 6, 2026

Weekly active users also surged from 16.8 million to 29.7 million in just two weeks, a jump of 12.9 million wallets, or 76.8%, pointing to a sharp acceleration in new participants entering the ecosystem rather than just existing users trading more.

@Solana ranks No. 2 in global spot crypto trading volume for the second straight week. $12.25B posted. pic.twitter.com/YsTfIqGm9n

— Solana Hub (@SolanaHub_) July 6, 2026

The network also ranked second in global spot crypto trading volume for the second consecutive week, processing $12.25 billion across centralized and decentralized exchanges combined. That figure held above Bybit’s $10.57 billion, with only Binance ahead. Two straight weeks at number two in global volume, combined with a weekly transaction record, positions Solana’s usage narrative well ahead of its price recovery.

Has July Historically Been Strong For Solana?

July is one of $SOL’s better months on the calendar. The average return sits at 24.6% and the median at 17.3%, with five of the past six Julys closing green.

The 2025 reading came in at 11.3%, 2024 added 17.3%, and 2022 surged 26.3%. The 2026 reading is already tracking at 9.93% early in the month, running slightly below the median pace but with most of July still ahead.

Solana Price Prediction: Upside and Downside Targets

  • Upside case: $SOL holds above the 100-day EMA at $81.60, the transaction record drives continued ecosystem attention, and price targets the 0.786 Fib at $90.18 as the next recovery milestone.
  • Downside case: The 100-day EMA rejects price, $SOL slips back below the 0.5 Fib at $79.27, and the 20-day EMA cluster near $76.44-$76.59 becomes the next support test.

Source: Original Article

Previous Post

Ruto signs law allowing Kenya’s central bank to provide emergency funding to troubled banks

Next Post

Gold price down over 30% from record high. Is this correction the start of a bear market?

RelatedPosts

Best Solana meme coins to watch as July rally builds

by MarketNewsBoard
2 hours ago

Speculative fever has returned to the Solana network with a vengeance, driving daily token creation to an 80-day high as July kicks into gear. Bolstered...

Read moreDetails

ETHA vs. IBIT: Does Ethereum or Bitcoin Belong in Your Portfolio?

by MarketNewsBoard
3 hours ago

ETFs containing Bitcoin and Ethereum have mirrored their underlying cryptocurrencies. Source: Original Article

Read moreDetails
Next Post

Gold price down over 30% from record high. Is this correction the start of a bear market?

Gold Prices Slip Amid Fed Rate Speculation and Stronger Dollar

Recommended.

Rules to Rein In CA Gas Prices Still on The Shelf

July 3, 2026

USD/CAD Price Forecast: Weakens below 1.4200 as Oil gains, but technicals still favor upside

July 8, 2026

Trending.

No Content Available
Market News Board | Market Analysis,Charts & News

MarketNewsBoard delivers trusted financial news, real-time market analysis, interactive charts, and economic insights across the global financial markets.

Covering Forex, Commodities, Stocks, Indices, Cryptocurrencies, and major economic events...

Follow Us

Market Overview

  • Forex Market
  • Commodities
  • Cryptocurrency News
  • Stocks
  • Indices
  • Crude Oil Prices
  • Economic Calendar

Resources

  • Central Banks News
  • Economy News
  • Interest Rate
  • Nonfarm Payroll
  • Charts

Tools

  • Currency Heat Map
  • Correlation Matrix
  • Market Sentiment
  • Currency Cross Rates
  • Crypto Rates
  • About Us
  • Contact Us
  • Disclaimer
  • Privacy Policy
  • Terms and Conditions

© 2026 MarketNewsBoard | Market Analysis, Charts & News.

AAPL
$314.10
AMZN
$242.13
BTC-USD
$62,015.99
EURUSD=X
$1.14
DX-Y.NYB
$100.98
NVDA
$203.01
TSLA
$392.28
DOW
$29.36
^N225
$66,819.05
JPY=X
$162.45
GBPUSD=X
$1.34
CAD=X
$1.42
NG=F
$3.21
BZ=F
$77.91
NFLX
$76.29
GOOG
$355.28
MSFT
$383.94
^RUT
$2,953.56
^FTSE
$10,489.04
AUDUSD=X
$0.694
CHF=X
$0.808
HG=F
$6.13
ETH=F
$1,740.50
No Result
View All Result
  • Home

© 2026 MarketNewsBoard | Market Analysis, Charts & News.