





















Key Highlights
- GBP/USD started a recovery wave and surpassed the 1.3320 resistance.
- A key contracting triangle is forming with support at 1.3290 on the 4-hour chart.
- EUR/USD struggled to extend its recovery wave above the 1.1475 resistance.
- WTI Crude Oil prices are under pressure below the $72.50 pivot level.
GBP/USD Technical Analysis
The British Pound started a recovery wave above 1.3200 against the US Dollar. GBP/USD gained pace after it settled above 1.3250.
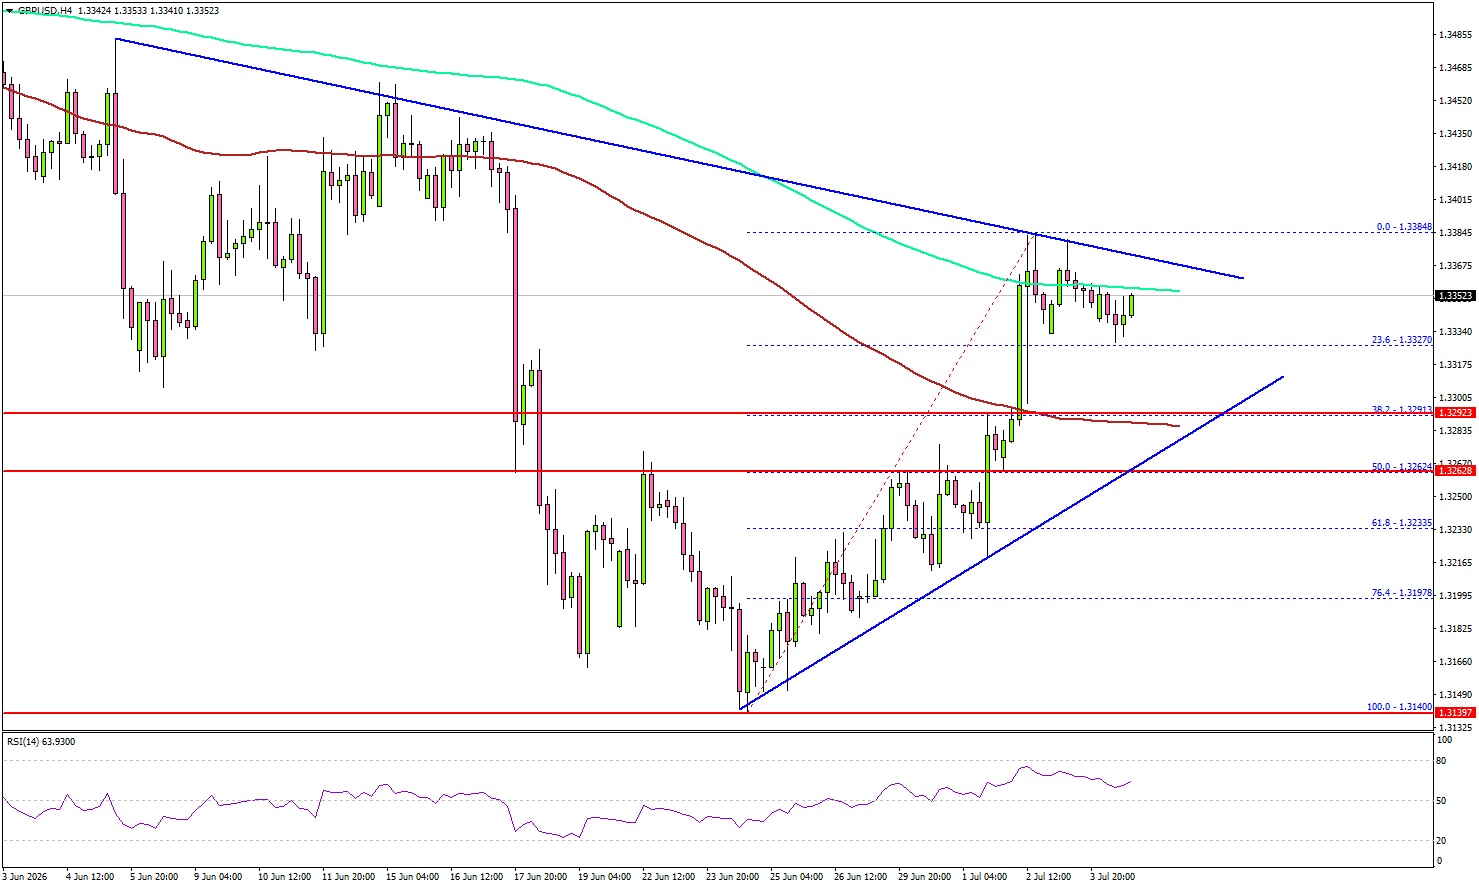
Looking at the 4-hour chart, the pair surged above the 100 simple moving average (red, 4-hour) and 1.3320. However, the bears defended the 1.3385 resistance and the 200 simple moving average (green, 4-hour).
A high was formed at 1.3384, and the pair started consolidating gains. There was a minor decline below 1.3350. If there is another decline, the pair might find support near 1.3290. Besides, there is a key contracting triangle forming with support at 1.3290.
The first major support could be near 1.3250. A downside break and close below 1.3250 might send the pair toward 1.3220. Any more losses could open the doors for a test of 1.3150.
On the upside, the bears might remain active near 1.3385. The next major resistance might be 1.3400. A close above 1.3400 could spark a sharp increase. In the stated case, the bulls could aim for a move to 1.3500.
Looking at EUR/USD, the bulls attempted a recovery wave, but they need a daily close above 1.1475 for upside continuation.
Upcoming Key Economic Events:
- UK’s Financial Stability Report.
- FPC Meeting Minutes.
- FPC Statement.
- BoE’s Mann speech.
Source: Original Article