


Disclosure: This article does not represent investment advice. The content and materials featured on this page are for educational purposes only.
Gold’s modern market history reflects decades of price swings shaped by inflation, interest rates, central bank actions, and geopolitical events.
Summary
- Gold’s post-1971 history reflects decades of inflation, monetary policy, crises, and shifting investor sentiment.
- Gold prices have been shaped by inflation, central bank policies, and geopolitical events since leaving the gold standard.
- From Bretton Woods to the 2008 crisis, gold’s market history highlights the impact of macroeconomic and policy shifts.
In open markets, gold has only been on the free market for the last 50-some years. Until the month of August 1971, its value had been pegged at $35 per ounce under the Bretton Woods monetary system.
However, the Nixon administration gave up on dollar convertibility to gold, which put the metal into a market that it had not known in living memory. The history that ensued is one of the more instructive in the history of prices in modern finance, driven by oil shocks, conscious rate policy, concerted institutional action, and periodic crises not foreseen by most of the actors until they actually happened.
The 1970s: Gold’s first decade without a fixed price
There were no fireworks following the move to a market-determined price. However, inflation rates in the Western world rose dramatically during the 1973 Arab oil embargo, and the gold chart started to move in a decade-defining manner. The metal was up to nearly $195 per ounce by the end of 1974, a nearly fivefold increase in three years. In 1975, the U.S. government legalized private gold ownership for American citizens, which brought some profit-taking and halted the upward trend for a short while. But structural factors – weak dollar, high inflation and growing geopolitical tension – held strong.
In January 1980, gold hit $850.00 an ounce due to the Iranian Revolution, the Soviet invasion of Afghanistan, and a series of inflationary pressure events during the Carter administration. That would be the first time the level is not matched in real, inflation-adjusted dollars in more than 30 years, something that is often overlooked when people talk about the bull market of the 2000s just in nominal terms.
The 1980s and 1990s: Two decades of consistent decline
The period since gold peaked in 1980 has been one of the most instructive in recent gold history, not for any one event, but rather because of the persistent conditions that held gold prices down for 20 years.
The Volcker rate environment
Under Paul Volcker, the Federal Reserve hiked rates hard to squelch “embedded inflation”. This did work, but the environment, with real rates quite positive and a strengthening dollar bringing in capital to U.S. assets, was fundamentally not good for a commodity that did not yield. From 1980, gold dropped consistently and found a range of $300-$500 during most of the decade. This was not caused by any one factor but by a combination of macro factors that were unfavorable to the metal.
Institutional selling in the 1990s
Another big negative wind was the coordinated central bank selling in the 1990s. A number of European governments decided to cut their gold stocks because they were unproductive and produced no return. Known publicly in advance, the UK’s auction of 415 tonnes between 1999 and 2002 took place close to what proved to be multi-decade low prices and became a benchmark in reserve management debates, which still exist today. The larger picture of Europe’s institutional sell added to the pressures on prices.
The 1999 low and the Washington agreement
In 1999, gold was almost $252 an ounce at the bottom. The Washington Agreement on gold, negotiated by European central banks in September this year, contained annual limits on the volume of sales and assisted in stabilizing the cycle low. By this time, the sentiment on gold was universally negative, and as the next decade proved, this was a good contrarian indicator.
The pattern that defined this era
The 1980s and 1990s form a pattern that can be seen numerous times on the longer time frame. Gold was found to underperform when the following occurred at the same time:
- Interest rates were meaningfully positive for a considerable amount of time.
- General trust in the financial system and in equity markets was largely not affected.
- The U.S. dollar was structurally strong on a trade-weighted basis
- Institutional reserve holders were net sellers
This combination is not a mechanical rule, but it did occur with uncanny uniformity during two successive decades. It also shows why the lows of gold in the latter part of the 1990s (now appearing to be extraordinary) seemed to be reasonable for the times.
The 2000s: A new bull market, then a crisis that surprised both ways
Gold’s bounce from the 1999 low was subdued initially. The metal started to rise from about $270 per ounce in 2001. The dot-com bubble burst, bringing into doubt the valuation of equities; the events of 9/11 drove up geopolitical risk premiums in all markets, and the U.S. fiscal budget increased dramatically to pay for military operations outside the country. The general trend of a falling dollar was an underlying theme.
In 2007, gold reached $800 an ounce for the first time since 1980. Then the financial crisis of 2008 had a chain reaction, surprising many observers. gold was hit hard in the last few months of 2008 as institutions began to dump assets in all asset classes to recoup losses and satisfy redemptions, and gold was no different. But with monetary easing having begun globally and with several major central banks applying near-zero rates as well as large-scale asset purchases, real interest rates went deeply negative, and gold began to rise again with a vengeance. It was at about $1,920 per ounce by September 2011, more than seven times higher than the 1999 low.
The following table outlines the general price ranges and main factors for each decade:
| Decade | Approx. Low | Approx. High | Key Driver |
| 1970s | $35 (fixed, 1971) | $850 (Jan 1980) | Inflation, oil shocks, USD weakness |
| 1980s | ~$280 | ~$500 | Positive real rates, disinflation |
| 1990s | ~$252 (1999) | ~$415 | Central bank selling, equity boom |
| 2000s | ~$270 (2001) | ~$1,000 (2008) | Dollar weakness, financial instability |
| 2010s | ~$1,050 (2015) | ~$1,920 (2011) | QE, then rate normalization |
| 2020s | ~$1,700 (2022) | $3,000+ (2025) | Pandemic, geopolitics, central bank buying |
The 2010s: A steep correction and a gradual return
When it peaked in 2011, not many expected gold to fall so much and so far. The metal’s annual decline was its worst since 1981 after the Fed indicated it would begin to slow asset purchases, which sent real yields higher and took one of gold’s primary props out from under the market. As of December 2015, prices had dropped to approximately $1,050 per ounce. The mining industry balance sheets were seriously strained, and analysts were generally negative.
An adjustment from that trough was slow and took place due to a number of factors — partly the weaker geopolitical demand from Brexit uncertainty, the U.S.-China trade tensions, and the uncertainty surrounding some of the world’s larger economies, and partly due to a structural change in how central banks manage their reserves. Emerging market institutions also started to add gold to their holdings in amounts never again witnessed in the modern history of gold demand: gold purchases in the countries of the modern data series exceeded 1,000 tonnes per year for the first time in more than 55 years. By mid-2019, gold had made a comeback, trading well over $1,500 per ounce and reclaiming the ground lost over the years.
The 2020s: New records and more nuanced drivers
COVID-19 has changed the global monetary landscape quickly and dramatically and gold prices have reacted as such. The metal’s historical record indicated that conditions in the form of near-zero interest rates and large-scale fiscal stimulus programs and significant monetary expansion would be favorable for the metal. Gold’s intraday price in August 2020 breached the $2,000-an-ounce threshold for the first time in history, topping out at about $2,075.
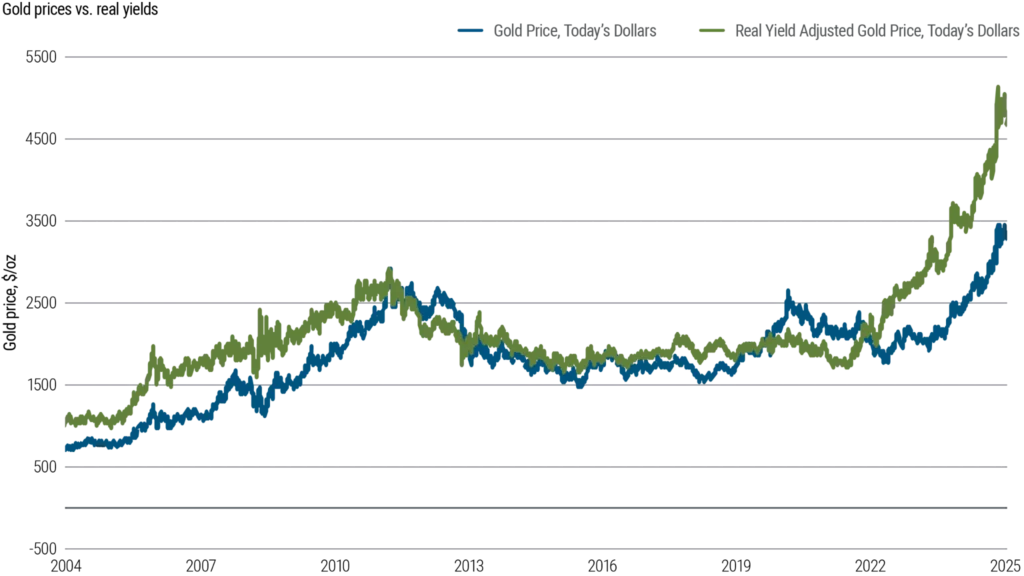
The inflation surge and why gold’s response was muted
The price reaction to the surge in inflation in 2021 and its following years has been weaker than many observers expected and there’s a reason why. The link between gold and inflation is often misunderstood and misinterpreted in the media. The message of the longer history is that the metal has been a better indicator of real interest rates, that is, it tends to do best when the inflation is higher than the nominal yield and real interest rates are negative. The nominal rate environment in many markets changed when central banks responded aggressively in 2022-2023, lifting nominal rates above the rate of price increases. That offset also weighed on gold’s ability to rally despite the high levels of headline inflation, as the metal spent much of 2022 trading between $1,700 and $2,000.
From $2,500 to $3,000 and the current environment
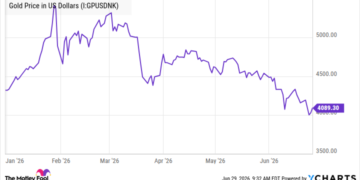
Gold ventured into fresh nominal highs in late 2023 as rate expectations eased, geopolitical fragmentation continued, and the structural central bank buying by reserve holders wanting to unwind dollar-denominated holdings continued. It crossed $2,500 in 2024 and breached $3,000 per ounce in early 2025. Today, prices are still at historically high levels as of mid-2026. The share of gold in global foreign exchange reserves has been gradually improving in recent years and has turned the tide in the long-term structural deterioration of the precious metal’s share, as several major countries are actively diversifying their reserves away from dollar-dominated portfolios.
What the full 50-year chart actually reveals
There are 50 years of price data to provide context but not certainty. This chart doesn’t show a consistent cycle or a reliable formula to follow in the future, but it does show which conditions have been reliable indicators of a significant price move and which areas confident stories have consistently missed.
Historical factors that historically signal bull markets in gold are:
- When the real interest rate is very negative, that is when the nominal interest rate is less than the rate of meaningful inflation
- Widespread loss of trust in key financial institutions or money systems
- Structural, persistent dollar weakness (trade-weighted basis)
- Near-term crises with no immediate resolution prospects (geopolitical crises)
- A significant continuous net purchase from institutional reserve buyers
- Monetary expansion that brings up issues of long-term purchasing power of currency
- Increased uncertainty about statements of sovereign debt paths in key economies
Factors that have been a drag on the price:
- With positive real interest rates, yield-bearing assets have a clear competitive edge.
- Favorable and sustainable financial position and widespread trust in equities.
- A structurally strong dollar combined with contained and declining inflation
Important turning points in the 50-year history:
1971: Fixed pricing ends, market discovery of gold begins, $35
1980: $850 peak as a result of compounding crises and entrenched inflation
1999: Price bottoms near $252, and the bearish consensus is at its lowest ebb.
2011: $1920 – end of the second major bull run with monetary conditions returning to normal levels.
2020: the first year to cross $2,000 in a pandemic environment
2025: Gold breaks through $3,000 and heads into new nominal space on structural and macro forces.
2026: Institutional demand for safe haven reaches an all-time high of $5,600.
History also reveals the challenges that have historically befallen overarching narratives. During the first stages of the crisis in 2008, gold gave back, just as it is usually considered a safe haven, and then rose when policy took action. Despite a strong inflation period in 2022, it still underperformed for much of the year. It fell over ten years for two decades, and recovery was called for each and every one, but the calls always proved to be premature.
Being honest about reading the 50-year chart means taking into account the periods when gold acted out of the ordinary and when it did what it was supposed to do. The price is a combination of financial policy, institutional flows, currency dynamics, and investor positions — all of which are interdependent and all of which are complex and cannot be summarized by a one-size-fits-all explanatory variable that is consistent through every time period.
Disclosure: This content is provided by a third party. Neither crypto.news nor the author of this article endorses any product mentioned on this page. Users should conduct their own research before taking any action related to the company.
Source: Original Article


