








Thursday, October 8, 2026
No Result
View All Result
  • Home
  • Market Overview
    • All
    • Crude Oil Prices
    • Cryptocurrency News
    • Economy News
    • ETFs
    • Foreign Exchange News
    • Indices
    • Stock Market

    UN Food Security Report Finds $540BN in Farm Subsidies Locked Into Commodities That Crowd Out Plant Foods – vegconomist

    AEGIS Hedging to Be Acquired by Private Equity at Goldman Sachs Alternatives

    Glencore plans large LME lead withdrawals after stocks surge, sources say

    AI Turns Competence into a Commodity: Evidence from 2.26 Million Freelance Contracts

    JPMAM adds commodities to lagging multi-asset strats

    New Houthi maritime strikes keep European gas futures pinned near multi-month peak

    • Crude Oil Prices
    • Cryptocurrency News
    • Economy News
    • ETFs
    • Indices
    • Stock Market
    • Foreign Exchange News
    • Commodities News
  • Forex Market
    • All
    • Central Banks News
    • Currencies
    • Interest Rate
    • Nonfarm Payroll

    Jobs report September 2026:

    US August Payroll Gain of 162,000 May Have Been Overstated by Seasonal Adjustments

    US September Nonfarm Payrolls Preview: Job Growth May Cool, How Will US Stocks, Dollar and Gold React?

    NZD/USD Market News, Chart & Analysis

    USDCAD Market News, Chart & Analysis

    AUDUSD Market News, Chart & Analysis

    USD/CHF Market News, Chart & Analysis

    GBP/USD Market News, Chart & Analysis

    USD/JPY Market News, Chart & Analysis

    • Central Banks News
    • Currencies
    • Interest Rate
    • Nonfarm Payroll
  • Commodities
    • All
    • Gold
    • Oil and Gas
    • Silver

    Oil & Gas Market News, Chart & Analysis

    XAGUSD Market News, Chart & Analysis

    XAUUSD Market News, Chart & Analysis

    Silver Outlook: VC PMI and Cycle Date Analysis Point to Next Bullish Opportunity

    Silver analysis today

    Gold and Silver Market Correction 2026: Is the Bull Market Over?

    • Gold
    • Oil and Gas
    • Silver
  • Crypto
    • All
    • Bitcoin
    • BNB
    • Ethereum
    • Litecoin
    • Solana
    • XRP

    BNB Market News, Chart & Analysis

    XRP Market News, Chart & Analysis

    Solana Market News, Chart & Analysis

    Litecoin Market News, Chart & Analysis

    Ethereum Market News, Chart & Analysis

    Bitcoin Market News, Chart & Analysis

    • Bitcoin
    • Ethereum
    • Litecoin
    • BNB
    • Solana
    • XRP
  • Charts
  • Economic Calendar
  • FX Analysis
    • EUR/USD
    • GBP/USD
    • USD/JPY
    • USD/CHF
    • AUDUSD
    • USDCAD
    • NZD/USD
No Result
View All Result
Home Market Overview
3 months ago

Worse than the Dot-com bubble: IBM stock crash

International Business Machines (IBM) published preliminary results for Q2 2026. Calling the results a disappointment would be a serious understatement.

The company’s shares collapsed by nearly 20%, dragging down a large part of the technology sector as well.

IBM technical analysis (D1) (13.07.2026)
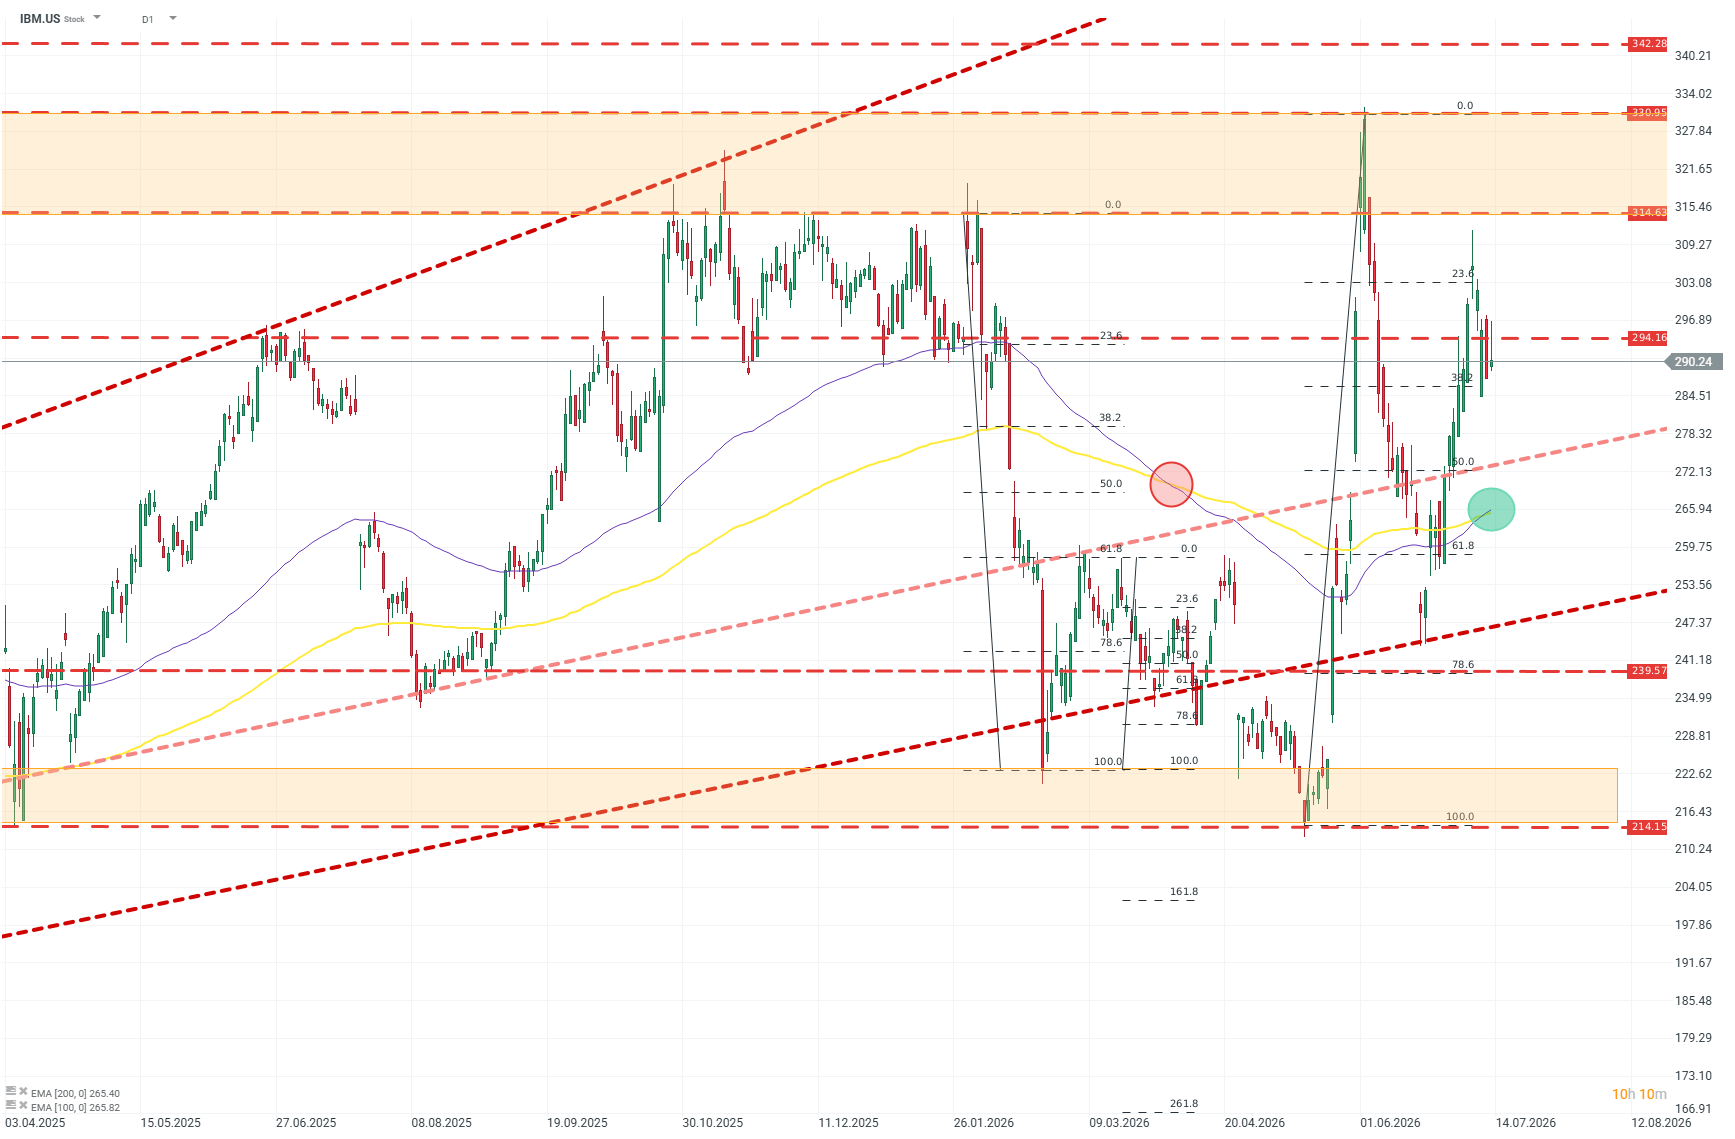
 

The sharp correction in IBM shares comes almost exactly at the moment when the EMA100 and EMA200 moving averages generated the so-called “golden cross,” a phenomenon that is relatively rare. Considering the Fibonacci ranges and significant price moves over recent months, the stock may finish the session below the 78.6% Fibonacci level (around USD 240). A much harder resistance level to break will be around USD 215, which buyers have defended repeatedly over the past two years. Source: xStation5

Why such a violent reaction?

The negative signal for the market coming from these results is very strong, but also not entirely clear. The headline figures from the release, without context, do not justify a reaction this extreme for a company of this size. At the open, the company lost over USD 50 billion in market capitalization.

  • Revenue came in at USD 17.2 billion versus the expected USD 17.8 billion.
  • EPS looked better, rising to USD 2.93, but still below market expectations, which were at least USD 3.00.

This release came against the backdrop of a strong run-up in the company’s valuation, supported by expansion in quantum computing and AI. Since May 2026, the shares rose from around USD 215 to nearly USD 300. Even a small earnings miss can be enough to meaningfully reprice a stock from which the market expects significant operating leverage, but that still does not explain the magnitude of the drop.

The key to understanding the market’s reaction lies in the CEO’s comments about capex.

The CEO noted that toward the end of the last quarter, customers suddenly and sharply began redirecting capex spending toward memory, which is becoming an increasingly acute bottleneck in the investment cycle. Management openly acknowledged that this could weigh on the company’s results, at least over the remainder of the current fiscal year.

IBM’s position also implies that if this giant is experiencing real pressure due to memory prices, then the rest of the sector is in a similar situation. Additional concern comes from the fact that the company does not عادة typically publish “preliminary releases.” The results were only supposed to be presented on July 22. This introduces chaos and fuels speculation and doubts, which is also a factor affecting the stock’s behavior.

Even so, for now a 15% to 20% decline is not pricing in a deep deterioration in profitability, but rather a postponement of revenue over time.

Source: Original Article

RelatedPosts

Market Overview

UN Food Security Report Finds $540BN in Farm Subsidies Locked Into Commodities That Crowd Out Plant Foods – vegconomist

July 22, 2026
Market Overview

AEGIS Hedging to Be Acquired by Private Equity at Goldman Sachs Alternatives

July 22, 2026
Market Overview

Glencore plans large LME lead withdrawals after stocks surge, sources say

July 22, 2026
Commodities

XAGUSD Market News, Chart & Analysis

September 28, 2026
Commodities

XAUUSD Market News, Chart & Analysis

September 27, 2026
BNB

BNB Market News, Chart & Analysis

September 27, 2026
Crypto

XRP Market News, Chart & Analysis

September 27, 2026
MarketNewsBoard

MarketNewsBoard delivers trusted financial news, real-time market analysis, interactive charts, and economic insights across the global financial markets.

Covering Forex, Commodities, Stocks, Indices, Cryptocurrencies, and major economic events...

Market Overview

  • Forex Market
  • Commodities
  • Cryptocurrency News
  • Stocks
  • Indices
  • Crude Oil Prices
  • Economic Calendar

Resources

  • Central Banks News
  • Economy News
  • Interest Rate
  • Nonfarm Payroll
  • Charts

Tools

  • Currency Heat Map
  • Correlation Matrix
  • Market Sentiment
  • Currency Cross Rates
  • Crypto Rates
  • About Us
  • Contact Us
  • Disclaimer
  • Privacy Policy
  • Terms and Conditions

© 2026 MarketNewsBoard | Market Analysis, Charts & News.

AAPL
$338.79
AMZN
$258.14
BTC-USD
$80,977.70
EURUSD=X
$1.12
DX-Y.NYB
$102.34
NVDA
$235.24
TSLA
$372.09
DOW
$28.36
^N225
$69,042.11
JPY=X
$158.30
GBPUSD=X
$1.32
CAD=X
$1.42
NG=F
$3.13
BZ=F
$105.62
NFLX
$71.19
GOOG
$346.02
MSFT
$530.09
^RUT
$2,767.12
^FTSE
$10,441.60
AUDUSD=X
$0.695
CHF=X
$0.833
HG=F
$6.57
ETH=F
$2,431.50
No Result
View All Result
  • Home

© 2026 MarketNewsBoard | Market Analysis, Charts & News.