



Friday, August 28, 2026
No Result
View All Result
  • Home
  • Market Overview
    • All
    • Crude Oil Prices
    • Cryptocurrency News
    • Economy News
    • ETFs
    • Foreign Exchange News
    • Indices
    • Stock Market

    UN Food Security Report Finds $540BN in Farm Subsidies Locked Into Commodities That Crowd Out Plant Foods – vegconomist

    AEGIS Hedging to Be Acquired by Private Equity at Goldman Sachs Alternatives

    Glencore plans large LME lead withdrawals after stocks surge, sources say

    AI Turns Competence into a Commodity: Evidence from 2.26 Million Freelance Contracts

    JPMAM adds commodities to lagging multi-asset strats

    New Houthi maritime strikes keep European gas futures pinned near multi-month peak

    • Crude Oil Prices
    • Cryptocurrency News
    • Economy News
    • ETFs
    • Indices
    • Stock Market
    • Foreign Exchange News
    • Commodities News
  • Forex Market
    • All
    • Central Banks News
    • Currencies
    • Interest Rate
    • Nonfarm Payroll

    Nonfarm employment declined by 23,000 in July, with the unemployment rate rising to 4.1 percent, signaling a slowdown in the job market

    Peso may rebound after weak US payrolls report

    Gold Price Forecast: Cooling Fed Rate Hike Expectations Boost Appeal as Price May Hit $4,500?

    Forex Today: Market Focus Shifts from Middle East to US Nonfarm Payrolls

    Summertime job market remains muggy

    US labor market shows signs of weakness! July nonfarm payrolls unexpectedly decrease by 23,000; May and June data revised down sharply. Fed rate hike expectations cool down.

    Nonfarm payrolls down in July; unemployment rate eases to 4.1%

    US payrolls fall 23,000 in July in shock report; May, June figures sharply revised down

    US nonfarm payrolls unexpectedly decline in July; unemployment rate eases to 4.1%

    • Central Banks News
    • Currencies
    • Interest Rate
    • Nonfarm Payroll
  • Commodities
    • All
    • Gold
    • Oil and Gas
    • Silver

    Silver Outlook: VC PMI and Cycle Date Analysis Point to Next Bullish Opportunity

    Silver analysis today

    Gold and Silver Market Correction 2026: Is the Bull Market Over?

    Silver Tracking Industrial Demand as Manufacturing and Inflation Shape Markets

    Silver VC PMI Outlook: Buy-Level Support Targets $61.51 Weekly Resistance

    Silver Tests Critical VC PMI Demand Zone as Cycle Window Hints Potential Reversal

    • Gold
    • Oil and Gas
    • Silver
  • Crypto
    • All
    • Bitcoin
    • Ethereum
    • Litecoin
    • Ripple
    • Solana
    • XRP

    Litecoin Price Prediction: Is LTC Heading Toward $40 After Trendline Breakdown?

    Ripple Launches Ripple Mint for Institutional RLUSD Access

    Litecoin Approaches Descending Channel Breakout as Technical Momentum Builds

    Ripple Launches Institutional Mint Platform for RLUSD Amid Transfer Volume Drop

    The ripple effects of farming injuries

    Litecoin Price Risks Drop to $35 if $43 Support Breaks

    • Bitcoin
    • Ethereum
    • Litecoin
    • Ripple
    • Solana
    • XRP
  • Charts
  • Economic Calendar
  • FX Analysis
    • EUR/USD
    • GBP/USD
No Result
View All Result
Home Commodities
2 months ago

The US, Largest Crude Oil Producer in the World, Produced 42% More than Saudi Arabia and 37% More than Russia in 2025

The strategic and economic importance for the US of US oil & gas production cannot be overemphasized. Canada is #4.

By Wolf Richter for WOLF STREET.

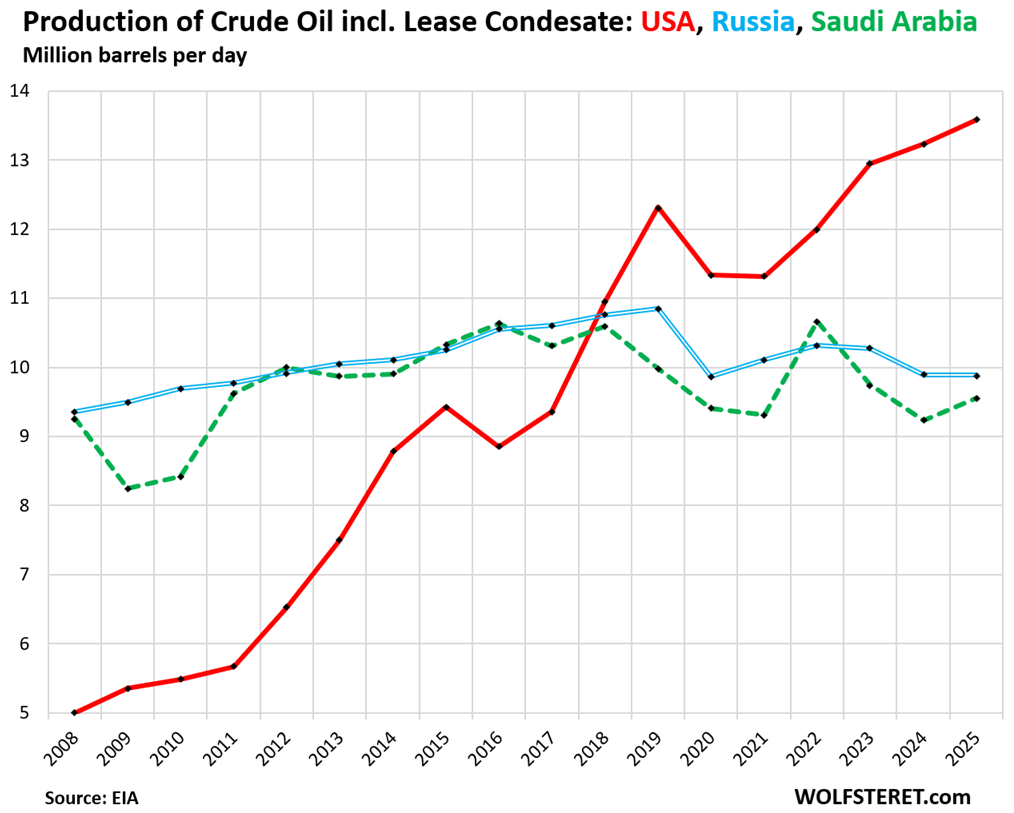
In 2018, the US became the largest crude oil producer in the world, surpassing Russia and Saudi Arabia. The gap has widened since then, with production declining in Russia and Saudi Arabia over those years, and soaring in the US. In 2025, US production of crude oil, including lease condensate, rose to a record 13.59 million barrels per day (MM b/d), up by 172% since 2008, according to EIA data. We discussed this on March 3, along with imports and exports — that the US is a net exporter of crude oil and petroleum products, including a huge exporter of diesel, gasoline, jet fuel, and other value-added products (with charts and all).

What is new today is the EIA’s update of the production data for other countries: #2 Russia produced 9.89 MM b/d of crude oil, including lease condensate, in 2025, down by a hair from a year earlier; and #3 Saudi Arabia produced 9.56 MM b/d of crude oil, including lease condensate, up by 3.5%.

And so in 2025, the US produced 37% more than Russia and 42% more than Saudi Arabia. In terms of quantity, the US produced a record 3.70 MM b/d more than Russia and a record 4.03 MM b/d day more than Saudi Arabia.
Lease condensate is a light, high-API gravity (45° to 75°) crude oil that typically enters the crude oil stream for refining or processing. It can also be blended with heavier more viscous crude oils to facilitate pipeline transportation. Or it can be used as refinery feedstock for the production of kerosene, jet fuel, diesel, gasoline, liquefied petroleum gas (LPG), light naphtha, and other products.

Further down on the world scale, to round off the top 10 producers of crude oil, including lease condensate, in 2025:

4. Canada: 5.0 MM b/d
5. Iraq: 4.4 MM b/d
6. China: 4.3 MM b/d
7. Iran: 4.1 MM b/d
8. UAE: 3.8 MM b/d
9. Brazil: 3.8 MM b/d
10. Kuwait: 2.6 MM b/d

“U.S. crude oil production has been buoyed by continued gains in drilling productivity and operational efficiency across key shale basins, which allow operators to extract more oil per well,” the EIA said in the report today.

Production in the Permian Basin of Texas and New Mexico rose by 4% in 2025, to 6.6 MM b/d, accounting for 48% of US production, according to the EIA. If the Permian Basin were a country, it would be the #4 producer in the world, ahead of Canada.

The strategic and economic importance of soaring US oil production – and the associated natural gas production that has made the US the largest natural gas producer in the world and the largest LNG exporter in the world – cannot be overemphasized:

It has created the strategic and economic advantages in the US of relatively cheap and reliable energy for transportation and commercial uses, as feedstock for the vast US petrochemical industry, for power generation, heating, fertilizers, and other purposes.

And it has reshuffled the global energy dynamics, which is why the closure of the Strait of Hormuz had little impact on supply in the US – though prices spiked initially due to massive speculation and due to the US market’s ties to the rest of the world via exports.

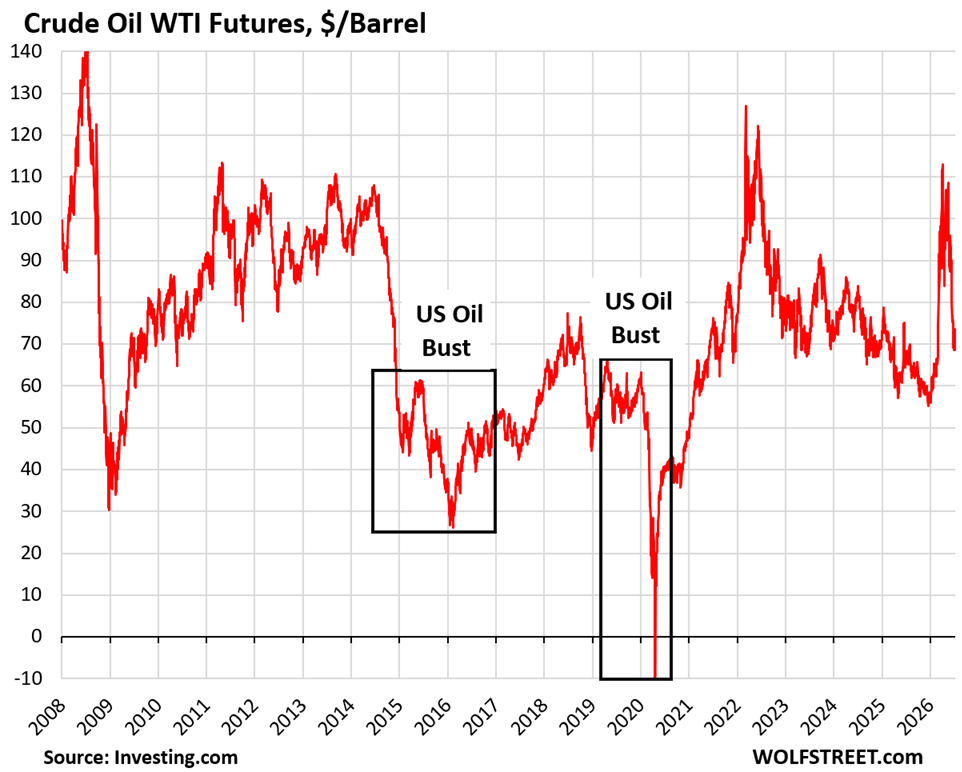
Meanwhile, the price of US benchmark grade West Texas Intermediate (WTI) has settled back down into the sweet spot for frackers at around $72 a barrel, after the brief speculative spike:
Enjoy reading WOLF STREET and want to support it? You can donate. I appreciate it immensely. Click on the mug to find out how:

Source: Original Article

RelatedPosts

Commodities

Silver Outlook: VC PMI and Cycle Date Analysis Point to Next Bullish Opportunity

July 24, 2026
Commodities

Silver analysis today

July 22, 2026
Commodities

Gold and Silver Market Correction 2026: Is the Bull Market Over?

July 21, 2026
Forex Market

Summertime job market remains muggy

August 7, 2026
Forex Market

US labor market shows signs of weakness! July nonfarm payrolls unexpectedly decrease by 23,000; May and June data revised down sharply. Fed rate hike expectations cool down.

August 7, 2026
Forex Market

Nonfarm payrolls down in July; unemployment rate eases to 4.1%

August 7, 2026
Forex Market

US payrolls fall 23,000 in July in shock report; May, June figures sharply revised down

August 7, 2026
Next Post

Amid recurring geopolitical tensions, gold prices are consolidating at a bottoming range, awaiting a rebound.

New Zealand Dollar extends three-day rally vs USD on hawkish RBNZ

Australian Dollar edges higher to near 0.6950 on RBA hawkish rhetoric

Market News Board | Market Analysis,Charts & News

MarketNewsBoard delivers trusted financial news, real-time market analysis, interactive charts, and economic insights across the global financial markets.

Covering Forex, Commodities, Stocks, Indices, Cryptocurrencies, and major economic events...

Market Overview

  • Forex Market
  • Commodities
  • Cryptocurrency News
  • Stocks
  • Indices
  • Crude Oil Prices
  • Economic Calendar

Resources

  • Central Banks News
  • Economy News
  • Interest Rate
  • Nonfarm Payroll
  • Charts

Tools

  • Currency Heat Map
  • Correlation Matrix
  • Market Sentiment
  • Currency Cross Rates
  • Crypto Rates
  • About Us
  • Contact Us
  • Disclaimer
  • Privacy Policy
  • Terms and Conditions

© 2026 MarketNewsBoard | Market Analysis, Charts & News.

AAPL
$314.58
AMZN
$256.26
BTC-USD
$79,394.82
EURUSD=X
$1.16
DX-Y.NYB
$99.21
NVDA
$227.98
TSLA
$354.81
DOW
$30.33
^N225
$66,405.56
JPY=X
$159.64
GBPUSD=X
$1.36
CAD=X
$1.39
NG=F
$2.89
BZ=F
$88.33
NFLX
$79.84
GOOG
$337.71
MSFT
$505.06
^RUT
$3,014.34
^FTSE
$10,818.90
AUDUSD=X
$0.72
CHF=X
$0.804
HG=F
$6.73
ETH=F
$2,497.00
No Result
View All Result
  • Home

© 2026 MarketNewsBoard | Market Analysis, Charts & News.