


Dow Jones Forecast: Trade Relief Supports Industrials Above 50,000
Dow Jones Gains Relative Strength as Investors Shift from Growth Stocks
The Dow Jones is performing better than the S&P 500 as it has low exposure to high-multiple technology stocks. This adds some relative strength to the index as investors move out of growth stocks. The Dow is also more exposed to value, industrial, healthcare and income-producing stocks. These areas tend to perform better during periods of volatility.
The EU-US trade deal is more supportive for the Dow. A high share of Dow products is related to industrial activity, global trade, manufacturing and supply chains. A tariff ceiling on EU exports and lower EU levies on US industrial goods can reduce uncertainty for large multinational companies. This could give Dow an edge over the S&P 500 in the short term.
But the tariffs on steel and aluminum imports can put strain on businesses that depend on the metals. An increase in input costs can decrease margins. If the US and EU are unable to reach an agreement on the aircraft subsidy matter, industrial stocks could also return to the sell-off mode. This makes the Dow susceptible to each and every new trade headline.
The drop in oil prices can have a mixed effect. Crude oil decline might help the transport, consumer and manufacturing sectors by easing cost pressure. But it may have a negative impact on energy-related stocks if the oil price decline signals weaker demand. So, lower inflation worries could be good for the Dow but only if the decline in oil does not signal a deeper slowdown.
The Dow Jones sentiment remains slightly positive versus the S&P 500. The index may attract defensive flows if investors continue to trim positions in high-priced tech stocks.
Dow Jones Pullback May Set Up Rally Toward 55,000
The long-term outlook for the Dow Jones remains constructive and the index has been trading within broadening wedge pattern since 2024. The emergence of the inverted head and shoulders pattern and then the ascending broadening wedge pattern supports a bullish outlook. But the index produced a sharp shadow candle last week after breaking above the 50,000 area. This indicates that the index may consolidate or correct lower before the next rally.

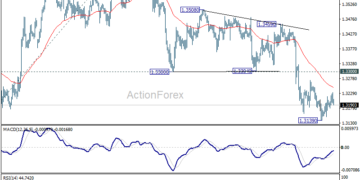
EUR/USD fell further to 1.1323 last week but recovered after breaching 1.1353 fibonacci level briefly. Initial bias remains neutral this week for consolidations. Further fall...
Read moreDetails