

















Wednesday, July 8, 2026
No Result
View All Result
  • Home
  • Market Overview
    • All
    • Crude Oil Prices
    • Cryptocurrency News
    • Economy News
    • ETFs
    • Foreign Exchange News
    • Indices
    • Stock Market

    Prices at pumps notwithstanding, oil a ‘major force’ in ND economy – Grand Forks Herald

    (UMAX) Strategic Market Analysis

    Oil Price Surges as US-Iran Ceasefire Over. Forecast as of 08.07.2026

    BTC inflation quagmire gets sticker as renewed Iran conflict sends oil price soaring: Crypto Daily

    Hazardous heat returns with heat indices 105+ likely this afternoon

    Sterling today: Pound eases as Fed, oil-driven dollar bid weighs

    • Crude Oil Prices
    • Cryptocurrency News
    • Economy News
    • ETFs
    • Indices
    • Stock Market
    • Foreign Exchange News
    • Commodities News
  • Forex Market
    • All
    • Central Banks News
    • Currencies
    • Interest Rate
    • Nonfarm Payroll

    Tanzania central bank buys 28 tons of gold to diversify reserves

    The age of central bank divergence has arrived

    EUR/USD Price Forecast: Euro hesitates above 1.1400 as geopolitical risks mount

    Pound Awaits Tighter Policy from Bank of England

    Chart of the Day: EURUSD Caught Between the Fed, ECB and Middle East Risks

    US Dollar Firms as Middle East Tensions Reignite Safe-Haven Demand. Forecast as of 08.07.2026

    USD/CAD Price Forecast: Weakens below 1.4200 as Oil gains, but technicals still favor upside

    The key global economic risks to watch in the second half of 2026

    Inflation: If they don’t know, now you know?

    • Central Banks News
    • Currencies
    • Interest Rate
    • Nonfarm Payroll
  • Commodities
    • All
    • Gold
    • Oil and Gas
    • Silver

    Oil prices jump after Trump’s Iran comments: What it could mean for Texas gas prices

    Gold prices could reach $6,000 in the long term and peak near $8,000, says West Point Gold CEO

    Local Gold Prices Drop to 84.7 Dinars per Gram…

    Kazakhstan eyes KZT350bn investment in oil and gas sector in 2026

    Gold prices stabilize in Baghdad, edge higher in Erbil – Shafaq News

    US Reimposes Iran Oil Sanctions After Tanker Attacks

    • Gold
    • Oil and Gas
    • Silver
  • Crypto
    • All
    • Bitcoin
    • Ethereum
    • Litecoin
    • Ripple
    • Solana
    • XRP

    Solana Price Rebounds 38% as Analysts Watch Return Above $100

    XRP price eyes drop to $1 as it loses a key support

    1 Unstoppable Cryptocurrency to Buy Before It Soars 3,442%, According to Tom Lee of Fundstrat

    Sending Bitcoin During a Bear Market: What to Know

    Bitcoin and Ethereum Flash Green, but is it a Bear Trap?

    Perpetual Futures Are Coming to a Popular Solana Crypto Wallet. That’s Why I’m Considering Buying Solana Right Now.

    • Bitcoin
    • Ethereum
    • Litecoin
    • Ripple
    • Solana
    • XRP
  • Charts
  • Economic Calendar
No Result
View All Result
Home Market Overview Foreign Exchange News

Oil Price Surges as US-Iran Ceasefire Over. Forecast as of 08.07.2026

by MarketNewsBoard
51 minutes ago
in Foreign Exchange News, Market Overview
Share on FacebookShare on Twitter
2026.07.08 2026.07.08
Oil Price Surges as US-Iran Ceasefire Over. Forecast as of 08.07.2026

Dmitri Demidenkohttps://www.litefinance.org/blog/authors/dmitri-demidenko/

logo

The escalation of the conflict in the Middle East has given Donald Trump an opportunity to declare that it’s all over. The deal is canceled, and everything is back to square one. Judging by the rally in Brent, that seems to be the case. However, are investors being led up the garden path? Let’s discuss this and develop a trading plan.

The article covers the following subjects:

Major Takeaways

  • The US is ready to withdraw from the deal with Iran.
  • The oil market turned bullish again.
  • China continues to stabilize the market.
  • Long positions on Brent can be considered with targets of $82.5 and $84.5.

Weekly Fundamental Forecast for Oil

Don’t count your chickens before they hatch. In recent weeks, the markets have lived with the sense that the worst of the conflict in the Middle East was behind them. Brent quickly returned to pre-war levels, and Macquarie and Citigroup predicted that prices would fall to $60 per barrel in the coming months. Iran’s attacks on tankers in the Strait of Hormuz, followed by the US response, appeared at first glance to be a black swan event. In reality, it was entirely predictable. The positions of the two sides were simply too far apart.

The main drivers behind Brent’s drop to February lows were record US exports—which allowed Europe and Asia to meet demand for the next 2–3 months—a reduction in global reserves to their lowest level since December 1990, and a sharp decline in Chinese imports. Against this backdrop, the resumption of traffic through the Strait of Hormuz resulted in oil shipments that proved unnecessary.

OECD Government Oil Stocks

Source: Bloomberg.

Adding to the bearish pressure are OPEC+ plans to raise production by 180,000 bpd, Iran’s rapid increase in exports, and the swift recovery of output in Gulf states. As a result, even 30–60 tankers passing through the world’s key oil chokepoint were enough to fuel concerns about a potential supply surplus. According to Vortexa, oil flows through the Strait of Hormuz before the escalation reached 40% of pre-conflict levels.

Interestingly, China has once again increased its oil purchases. While some have described Beijing as a savior of the global economy, its actions are largely driven by market conditions: China tends to buy more when Brent prices decline and scale back imports when prices rise.

Chinese Oil Imports

Source: Bloomberg.

In general, given the reluctance of OECD countries to quickly rebuild their stockpiles prior to Iran’s attacks on tankers in the Strait of Hormuz, Brent crude was indeed closer to $60 than to $80 per barrel. The escalation of the conflict in the Middle East changed everything. The oil market quickly shifted from contango to backwardation, where more distant contracts are cheaper than those for immediate delivery. This indicates either strong demand or supply constraints. Clearly, the latter is the case.

Donald Trump’s words that it’s all over and he doesn’t want to deal with Iran suggest that investors can expect more intense hostilities than before unless the US leader changes his mind.

Weekly Trading Plan for Brent

Brent‘s rebound from the lower boundary of the $70–80 range signaled profit-taking on short positions and triggered a reversal. A further escalation of the conflict in the Middle East would provide grounds for increasing long positions with targets of $82.5 and $84.5. Alternatively, if the US and Iran return to the negotiating table, Brent crude will likely remain stuck in this consolidation range.


This forecast is based on the analysis of fundamental factors, including official statements from financial institutions and regulators, various geopolitical and economic developments, and statistical data. Historical market data are also considered.

Price chart of UKBRENT in real time mode

The content of this article reflects the author’s opinion and does not necessarily reflect the official position of LiteFinance broker. The material published on this page is provided for informational purposes only and should not be considered as the provision of investment advice for the purposes of Directive 2014/65/EU.


According to copyright law, this article is considered intellectual property, which includes a prohibition on copying and distributing it without consent.

Rate this article:

{{value}} ( {{count}} {{title}} )

Source: Original Article

Previous Post

BTC inflation quagmire gets sticker as renewed Iran conflict sends oil price soaring: Crypto Daily

Next Post

(UMAX) Strategic Market Analysis

RelatedPosts

Prices at pumps notwithstanding, oil a ‘major force’ in ND economy – Grand Forks Herald

by MarketNewsBoard
39 minutes ago

GRAND FORKS — North Dakota’s oil and natural gas industry makes up more than 30% of the state’s economy and pays more than half of...

Read moreDetails

(UMAX) Strategic Market Analysis

by MarketNewsBoard
51 minutes ago

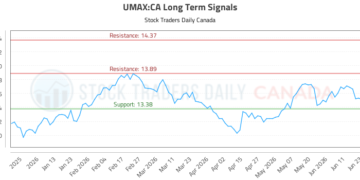
Strategic Market Analysis for Hamilton Utilities YIELD MAXIMIZER TM ETF (UMAX) with Trading Signals Source: Original Article

Read moreDetails
Next Post

(UMAX) Strategic Market Analysis

Oil prices jump after Trump's Iran comments: What it could mean for Texas gas prices

Recommended.

Securitize (SECZ) eyes acquisitions with $400 million war chest after going public

July 6, 2026

(SOT.DB) Strategic Market Analysis

July 5, 2026

Trending.

No Content Available
Market News Board | Market Analysis,Charts & News

MarketNewsBoard delivers trusted financial news, real-time market analysis, interactive charts, and economic insights across the global financial markets.

Covering Forex, Commodities, Stocks, Indices, Cryptocurrencies, and major economic events...

Follow Us

Market Overview

  • Forex Market
  • Commodities
  • Cryptocurrency News
  • Stocks
  • Indices
  • Crude Oil Prices
  • Economic Calendar

Resources

  • Central Banks News
  • Economy News
  • Interest Rate
  • Nonfarm Payroll
  • Charts

Tools

  • Currency Heat Map
  • Correlation Matrix
  • Market Sentiment
  • Currency Cross Rates
  • Crypto Rates
  • About Us
  • Contact Us
  • Disclaimer
  • Privacy Policy
  • Terms and Conditions

© 2026 MarketNewsBoard | Market Analysis, Charts & News.

AAPL
$310.66
AMZN
$245.98
BTC-USD
$62,201.63
EURUSD=X
$1.14
DX-Y.NYB
$101.21
NVDA
$196.93
TSLA
$402.90
DOW
$28.64
^N225
$66,819.05
JPY=X
$162.49
GBPUSD=X
$1.33
CAD=X
$1.42
NG=F
$3.30
BZ=F
$78.11
NFLX
$76.18
GOOG
$363.62
MSFT
$388.84
^RUT
$2,982.49
^FTSE
$10,541.93
AUDUSD=X
$0.692
CHF=X
$0.808
HG=F
$6.08
ETH=F
$1,750.00
No Result
View All Result
  • Home

© 2026 MarketNewsBoard | Market Analysis, Charts & News.