










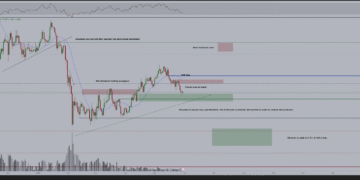



Wedge Projection and Broader Upside Potential
Moreover, the top of the wedge pattern at $3.49 is a higher potential target. Typically, a minimum target from a wedge pattern is the beginning of the pattern. This does not mean that it will be reached, only that it could be following a pullback and renewed signs of strength. The uptrend price structure would need to be retained during a retracement for this bullish scenario to remain possible. There is also the long-term uptrend line, which represents potential dynamic resistance, and it may yet be approached.
Key Pullback Levels and Market Structure
Initial support on a pullback may be found near the 100-day moving average around $3.16, which aligns with the prior trend high resistance zone of $3.14 and now potential support. Be aware that since the 10-day average is rising, it will continue to move closer to the higher support zone. This broader structure, following Friday’s extension toward key resistance, keeps price action coiled between rising support and overhead resistance within the channel framework.
If you’d like to know more about how to trade natural gas, please visit our educational area.