


In the world of trading, it is crucial to grasp market movements swiftly. Japanese candlesticks represent an indispensable tool for analyzing prices. Candlestick patterns empower both novice and seasoned traders with the ability to quickly discern market movements, both past and future, quickly.
This article explains how to read candlestick charts, provides a comprehensive overview of candlestick analysis and market behavior, empowering you to make informed decisions that align with your financial goals.
The article covers the following subjects:
Major Takeaways
- A candlestick chart is a technical analysis tool that shows changes in the price of an asset over a certain period. The chart shows Japanese candlesticks, each displaying information about the price.
- There are different types of candlesticks: bullish candlesticks indicate price increases, while bearish candlesticks reveal price decreases. There are also neutral candlesticks, which appear in conditions of market uncertainty.
- A candlestick has a body that reflects the difference between the opening and closing prices for a given period. In addition, the body has upper and lower shadows, which show the maximum and minimum prices over a certain time.
- A candlestick chart is more illustrative than a line or bar chart. It tells you right away where the price was at the beginning and end of the period and how the price has changed over time.
- When trading on a candlestick chart, traders analyze various candlestick patterns to predict future price movements, confirming such patterns using technical indicators.
- Advantages: charts are easy to read, show patterns, and generate signals. Disadvantages: subjective interpretation, requiring confirmation with additional tools. In volatile markets, charts may give false signals.
- To trade using candlestick analysis patterns, use an H1 time frame or higher. Candlestick patterns are more clearly defined on such time frames and generate fewer false signals.
- Candlestick patterns are more effective in highly liquid markets, such as Forex or stocks.
What Is a Candlestick Chart?
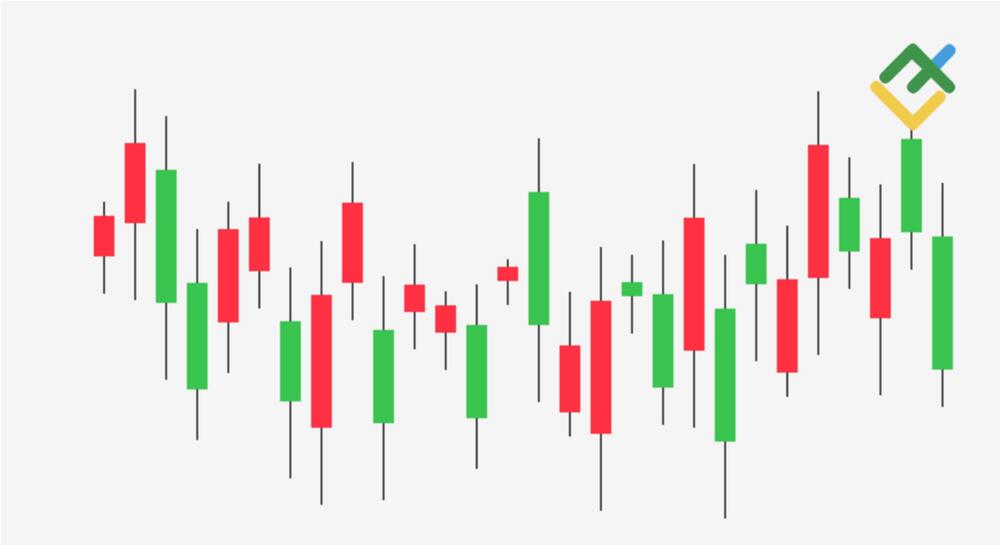
A candlestick chart shows the price movement of an asset over time. Each candle represents a time interval, such as one minute, hour, or day, and displays the opening and closing prices, along with the lowest and highest values reached during that interval.
Candlestick vs. Bar Charts
Japanese candlesticks and bars are both important to traders. They show price changes, but look different. Which is better? The answer depends on your preferences and trading style.
|
Feature |
Japanese candlesticks |
Bars |
|
Visual representation |
Colored bullish or bearish candles with bodies and shadows |
Vertical line with opening and closing levels |
|
Readability |
Easy to perceive the direction of price movement |
Requires more effort to analyze |
|
Ease of pattern identification |
More clearly visible chart patterns |
Patterns are more difficult to recognize |
|
Application |
Short-term and medium-term trading |
Long-term trading and trend analysis |
|
Information displayed |
Opening, closing, high, and low prices |
Same information, but poorer visualization |
Components of Japanese Candlesticks
A candlestick reflects how the price of an asset has changed over a certain period. It has the following components:
- Opening price: the price at the start of the period (e.g., at the start of the day or hour).
- Highest price: the highest price reached during the period.
- Lowest price: the lowest price reached during the period.
- Closing price: the price at the end of the period.
- Candlestick shadows are narrow vertical lines at the top and bottom of the candlestick. They show the difference between the highest and lowest prices.
- The color of the candlestick indicates the price direction. Green (or white) means that the price has risen, while red (or black) means that it has fallen.
Common Types of Candlestick Patterns
Candlestick patterns are formations on price charts that show when a trend might reverse, continue, or consolidate. There are many of them, and they can be used to predict future price movements.
Mastering the most common candlestick patterns will allow you to make informed decisions when trading. In this section, you will learn how to read Japanese candlesticks.
Single Candlestick Patterns
Single candlestick patterns appear during a single trading period. They can provide rapid insights into market trends. They indicate whether buyers or sellers prevail. Such patterns can signal a likely change in trend or a continuation of the current momentum.
Hammer
A Hammer candlestick pattern shows up after a price drop and hints at possible growth. It has a small body at the top and a long shadow at the bottom, implying that the bearish trend is ending and a reversal is imminent.
Hanging Man
A Hanging Man bearish candle pattern occurs in uptrends. It has a small body, a long lower shadow at least twice the length of the body, and almost no upper shadow. This pattern signals that the trend is about to reverse and the price will decline.
Doji
A Doji candlestick tells traders that there is no clear direction in the market, as its opening price is almost equal to the closing price. This candlestick has no or very little body, which indicates that buyers and sellers are struggling to gain the upper hand. Doji candlesticks often signal a trend reversal.
Types of Doji candles:
- A Dragonfly Doji candle has a long lower shadow and a small or no upper shadow.
- A Long-Legged Doji has long upper and lower shadows.
- A Rickshaw Man is similar to a Long-Legged Doji, but the upper and lower shadows are more or less equal in length.
- A Gravestone Doji has a long upper shadow and a small or no lower shadow.
- A Classic Doji has almost identical opening and closing prices in the middle of the candlestick.
- A Four-Price Doji has open, close, high, and low prices at the same level.
Double Candlestick Patterns
Double candlestick patterns are highly effective tools for chart analysis. They reveal potential shifts or continuations in a trend. As it comes from their name, these patterns consist of two candlesticks. Notably, it is important to carefully study the market conditions to ensure their accuracy.
Engulfing
A Bullish Engulfing candle pattern appears in downtrends. It consists of a small bearish candlestick, which signals a continuation of the decline. Then a large bullish candle appears, completely covering the previous one. This means that buyers have gained strength, and an uptrend may begin.
A Bearish Engulfing pattern emerges during uptrends. First, there is a small bullish candlestick, which indicates that the upward movement is still continuing. After that, a large bearish candlestick appears, completely covering the small bullish one, assuming that the uptrend is likely to reverse.
Dark Cloud Cover
A Dark Cloud Cover is a bearish dual Japanese candlestick pattern that signals the end of an uptrend. It appears when a bearish candlestick follows a bullish candlestick. This bearish candlestick opens above the high of the previous candlestick but closes well below its midpoint, signaling that sellers are gaining strength.
Piercing
A Piercing dual candlestick pattern indicates a possible upward reversal after a prolonged decline. First, a bearish candlestick appears, followed by a bullish candlestick that opens below the low of the previous candlestick and closes above the middle of its body. This may signal a trend reversal.
Triple Candlestick Patterns
Triple candlestick patterns mark a possible trend reversal or continuation. To get a handle on these patterns, you need to understand the market context. A solid analysis of these patterns can help you find profitable trading opportunities.
Evening and Morning Stars
A Morning Star signals buyers that a bearish trend may end soon. It consists of three candlesticks: first, a large red one; then, a small Doji or a Spinning Top candle; and finally, a large green one that closes above the middle of the first candlestick. The small candlestick shows that sellers are weakening, and the green candlestick reflects that buyers are gaining the upper hand.
An Evening Star pattern tells sellers that a bullish trend is losing steam. The formation consists of three candlesticks: a large green one, a small Doji or a Spinning Top, and a large red candle. The red candlestick should close below the middle of the first green candlestick.
Three White Soldiers
A Three White Soldiers candlestick pattern gives a buy signal, assuming that a downtrend may have ended or that an uptrend will continue. It represents three white or green consecutive candlesticks. The shadows of these candlesticks are small or absent. Each new candlestick opens within the body of the previous one and closes higher. This pattern shows that buyers are gaining strength, preparing to push the price higher.
Three Black Crows
A Three Black Crows pattern hints at the reversal of an uptrend. It comprises three long red candlesticks in a row with almost no shadows. Each new candlestick opens within the body of the previous one and closes lower.
Technical Analysis of Candlestick Charts: Comprehensive Trading Strategy
Let’s take a look at an example of a combining trading strategy on a 4-hour chart of the EURUSD currency pair.
We should determine the market context and catch a trend reversal:
- The price moved in a downward trend before reversal candlestick analysis patterns began to appear.
- Next, we see the beginning of a bullish trend.
- Determine the support levels from which the price rebounds to the upside.
- Identify the resistance level where the price may also reverse and place a take-profit order.
- A Hammer bullish pattern is forming.
- There is confirmation from a Bullish Engulfing reversal pattern.
- Tick volume increases.
- MACD values crossed the zero line upwards, giving a buy signal.
- The RSI values left the oversold zone, generating a signal to open a long trade.
- The MFI began to increase, rebounding from the lower boundary. Liquidity inflow is observed, which is another buy signal.
- Open a long position at 1.1205, with additional signals from the VWAP and SMA 20 indicators.
- Set a stop-loss order at 1.1099 to minimize risk.
- Place take-profit orders at resistance levels of 1.1276, 1.1385, and 1.1437.
- Lock in profits, as Evening Star bearish reversal patterns are forming in the 1.1437 area.
- A Two Black Crows pattern emerges.
- The asset’s price consolidates, bullish momentum fades, and the Three Black Crows pattern completes.
- Tick volume decreases, signaling a bearish reversal.
- MACD values cross the signal line downwards, indicating selling pressure.
- RSI values have left the overbought zone and are falling.
- MFI values have also turned down near the upper boundary, with liquidity outflow giving a sell signal.
Notably, you can significantly improve your financial results by combining candlestick analysis patterns with technical analysis tools.
Conclusion
Candlestick analysis is paramount for traders. The ability to recognize candlestick patterns helps traders find the best entry points for trades and pinpoint support and resistance levels, allowing them to make informed decisions.
Combining candlestick analysis with other technical analysis tools provides a detailed market snapshot and increases your chances of generating profits. However, remember that no method can guarantee 100% success, so risk management is still very important in trading.
Learn how to trade wisely with candlestick patterns by opening a free demo account with LiteFinance.
Get access to a demo account on an easy-to-use Forex platform without registration
Candlestick Patterns Analysis FAQs
The content of this article reflects the author’s opinion and does not necessarily reflect the official position of LiteFinance broker. The material published on this page is provided for informational purposes only and should not be considered as the provision of investment advice for the purposes of Directive 2014/65/EU.
According to copyright law, this article is considered intellectual property, which includes a prohibition on copying and distributing it without consent.
Source: Original Article


