





Thursday, August 27, 2026
No Result
View All Result
  • Home
  • Market Overview
    • All
    • Crude Oil Prices
    • Cryptocurrency News
    • Economy News
    • ETFs
    • Foreign Exchange News
    • Indices
    • Stock Market

    UN Food Security Report Finds $540BN in Farm Subsidies Locked Into Commodities That Crowd Out Plant Foods – vegconomist

    AEGIS Hedging to Be Acquired by Private Equity at Goldman Sachs Alternatives

    Glencore plans large LME lead withdrawals after stocks surge, sources say

    AI Turns Competence into a Commodity: Evidence from 2.26 Million Freelance Contracts

    JPMAM adds commodities to lagging multi-asset strats

    New Houthi maritime strikes keep European gas futures pinned near multi-month peak

    • Crude Oil Prices
    • Cryptocurrency News
    • Economy News
    • ETFs
    • Indices
    • Stock Market
    • Foreign Exchange News
    • Commodities News
  • Forex Market
    • All
    • Central Banks News
    • Currencies
    • Interest Rate
    • Nonfarm Payroll

    Nonfarm employment declined by 23,000 in July, with the unemployment rate rising to 4.1 percent, signaling a slowdown in the job market

    Peso may rebound after weak US payrolls report

    Gold Price Forecast: Cooling Fed Rate Hike Expectations Boost Appeal as Price May Hit $4,500?

    Forex Today: Market Focus Shifts from Middle East to US Nonfarm Payrolls

    Summertime job market remains muggy

    US labor market shows signs of weakness! July nonfarm payrolls unexpectedly decrease by 23,000; May and June data revised down sharply. Fed rate hike expectations cool down.

    Nonfarm payrolls down in July; unemployment rate eases to 4.1%

    US payrolls fall 23,000 in July in shock report; May, June figures sharply revised down

    US nonfarm payrolls unexpectedly decline in July; unemployment rate eases to 4.1%

    • Central Banks News
    • Currencies
    • Interest Rate
    • Nonfarm Payroll
  • Commodities
    • All
    • Gold
    • Oil and Gas
    • Silver

    Silver Outlook: VC PMI and Cycle Date Analysis Point to Next Bullish Opportunity

    Silver analysis today

    Gold and Silver Market Correction 2026: Is the Bull Market Over?

    Silver Tracking Industrial Demand as Manufacturing and Inflation Shape Markets

    Silver VC PMI Outlook: Buy-Level Support Targets $61.51 Weekly Resistance

    Silver Tests Critical VC PMI Demand Zone as Cycle Window Hints Potential Reversal

    • Gold
    • Oil and Gas
    • Silver
  • Crypto
    • All
    • Bitcoin
    • Ethereum
    • Litecoin
    • Ripple
    • Solana
    • XRP

    Litecoin Price Prediction: Is LTC Heading Toward $40 After Trendline Breakdown?

    Ripple Launches Ripple Mint for Institutional RLUSD Access

    Litecoin Approaches Descending Channel Breakout as Technical Momentum Builds

    Ripple Launches Institutional Mint Platform for RLUSD Amid Transfer Volume Drop

    The ripple effects of farming injuries

    Litecoin Price Risks Drop to $35 if $43 Support Breaks

    • Bitcoin
    • Ethereum
    • Litecoin
    • Ripple
    • Solana
    • XRP
  • Charts
  • Economic Calendar
  • FX Analysis
    • EUR/USD
    • GBP/USD
No Result
View All Result
Home Commodities
2 months ago

Gold can fall up to 16% to $3400/oz, say analysts; should you buy the dip? | Markets News


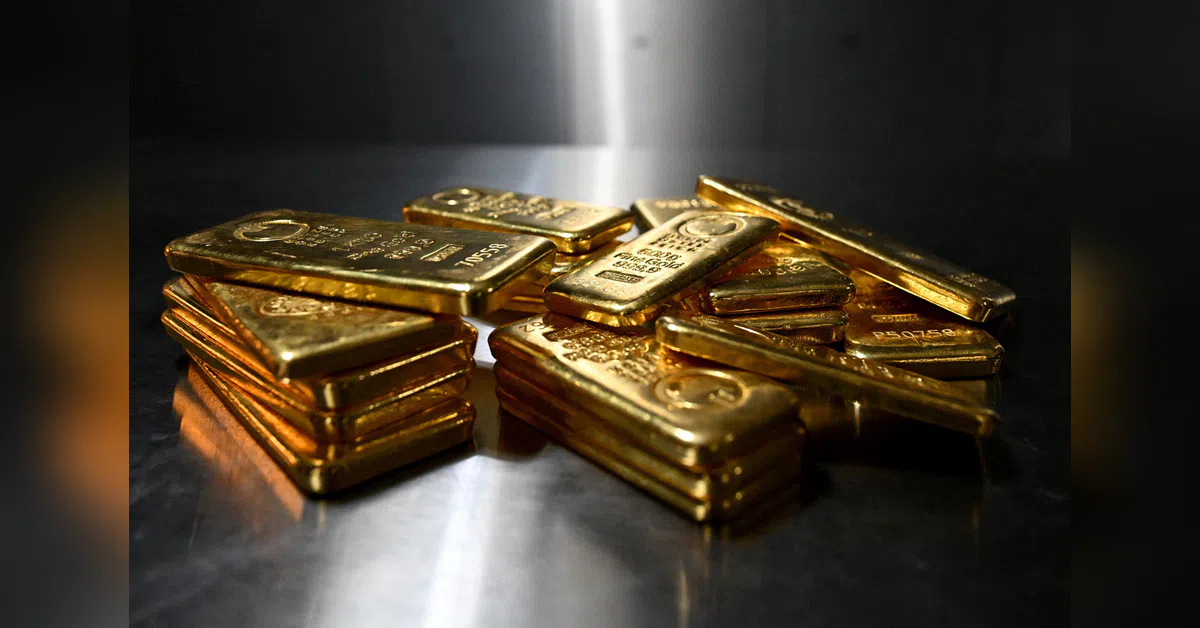
Gold price crash: Gold’s stellar rally may not be over, but the road ahead could get bumpier. After scaling record highs earlier this year, the yellow metal has come under pressure as a stronger US dollar and rising crude oil prices amid West Asia crisis weigh on sentiment.


Already in the bear territory after receding 27% from its record high level of $5,595/ounce hit in January this year, analysts foresee scope of a further decline of up to 16% to $3400-3500 levels as the yellow metal could take a breather following strong bull run. An asset is said to be in bear territory when it falls 20% or more from its recent high in a short span of time.


Hareesh V, Head of Commodity Research at Geojit Financial Services, said that while the broader outlook remains positive, a technical correction is quite possible because gold prices have almost doubled over the past one to two years. Such a correction could likely find support around the $3,400–3,500 level before the next leg of the rally, he projected.


The majority of the correction in the precious metal seen this year has come amid the war in Middle East due to double whammy in the form of higher crude oil prices that raises concerns around inflation and Fed rate hike, and a stronger US dollar which dims the appeal of bullion for buyers of other currencies. Since end of February alone, international gold prices have crashed 23%.


Earlier today, international gold prices eased 1.5% to $4,057 as oil prices jumped 4% after US and Iran exchanged fresh fire. 


Apurva Sheth, Head of Research at Samco Securities, said $4,000 is a crucial support level for gold but in the worst case or intraday panic kind of scenario, $3,500 can be possible. However, he remains bullish on the longer term gold trajectory. 


Should you buy gold on dips?

The Samco analyst said over a long-term frame of three years, his target for gold is around $7,000. His sentiments are echoed by Hareesh V of Geojit, who despite expecting near-term weakness, finds the broader outlook positive because the underlying fundamentals continue to be supportive. “Every dip can be viewed as a buying opportunity.”


Analysts believe that geopolitical risks aided gold before the US-Iran war and may do so again as risks remain elevated, overriding higher yields and firms US dollar.


Global brokerage HSBC in a recent note, dated July 9, said that a post-Iran conflict climate will leave the world facing many of the same issues that drove gold. “While yields may be higher and the USD firmer, compared to before the conflict, other long-running issues will lend aid to bullion,” it added even as it mildly lowered its long-term outlook for gold.


HSBC slashed its gold outlook to $4,560/ounce from $4,864/ounce earlier. 


Another factor that could drive the prices is central bank buying. “Many central banks continue to accumulate gold, which signals that they also expect global growth to remain under pressure. In such an environment, gold continues to be viewed as a preferred safe-haven asset,” said Hareesh V. 


HSBC also said that central banks moderated purchases last year and in 1H’26 due to high prices but are key to defining a price floor and may support prices longer term.


According to a World Gold Council (WGC) survey in June 2026, global central bank are expected to increase their gold reserves over the next 12 months, highlighting gold’s increasingly strategic role within reserve portfolios. Gold’s performance during times of crisis, long-term store of value and portfolio diversification make the precious metal an attractive bet. 


Central banks have accumulated an average of 1,000 tonnes of gold over the past four years, which is significantly higher from the 500 tonnes average over the preceding decade, shows WGC data.


Commenting on the longer term gold targets, Harshal Dasani, Business Head at INVasset PMS, said that on the 12-month horizon, the gold range extends toward $4,700 to $5,200, anchored on central bank Q1 2026 purchases at 337 tonnes marking the strongest first-quarter print on record, US gross federal debt at around 125 per cent of GDP, developed-market fiscal deterioration, and the multi-year geopolitical fragmentation trade continuing to compound.


“Any drawdown into the $3,900 to $4,000 gold zone is a buying opportunity, not a reversal signal,” he added.


Disclaimer: View and outlook shared belong to the respective brokerages/analysts and are not endorsed by Business Standard. Readers’ discretion is advised.


Source: Original Article

RelatedPosts

Commodities

Silver Outlook: VC PMI and Cycle Date Analysis Point to Next Bullish Opportunity

July 24, 2026
Commodities

Silver analysis today

July 22, 2026
Commodities

Gold and Silver Market Correction 2026: Is the Bull Market Over?

July 21, 2026
Forex Market

Summertime job market remains muggy

August 7, 2026
Forex Market

US labor market shows signs of weakness! July nonfarm payrolls unexpectedly decrease by 23,000; May and June data revised down sharply. Fed rate hike expectations cool down.

August 7, 2026
Forex Market

Nonfarm payrolls down in July; unemployment rate eases to 4.1%

August 7, 2026
Forex Market

US payrolls fall 23,000 in July in shock report; May, June figures sharply revised down

August 7, 2026
Next Post

Asia's LNG imports recover, drawing cargoes from needy Europe

New Solana App FOMO Overtakes Jupiter and Phantom in Daily Revenue

Markets open week nervous at fresh Middle East escalation

Market News Board | Market Analysis,Charts & News

MarketNewsBoard delivers trusted financial news, real-time market analysis, interactive charts, and economic insights across the global financial markets.

Covering Forex, Commodities, Stocks, Indices, Cryptocurrencies, and major economic events...

Market Overview

  • Forex Market
  • Commodities
  • Cryptocurrency News
  • Stocks
  • Indices
  • Crude Oil Prices
  • Economic Calendar

Resources

  • Central Banks News
  • Economy News
  • Interest Rate
  • Nonfarm Payroll
  • Charts

Tools

  • Currency Heat Map
  • Correlation Matrix
  • Market Sentiment
  • Currency Cross Rates
  • Crypto Rates
  • About Us
  • Contact Us
  • Disclaimer
  • Privacy Policy
  • Terms and Conditions

© 2026 MarketNewsBoard | Market Analysis, Charts & News.

AAPL
$313.45
AMZN
$260.28
BTC-USD
$79,588.52
EURUSD=X
$1.16
DX-Y.NYB
$99.24
NVDA
$209.66
TSLA
$345.82
DOW
$30.33
^N225
$66,131.98
JPY=X
$159.47
GBPUSD=X
$1.36
CAD=X
$1.39
NG=F
$2.91
BZ=F
$87.04
NFLX
$81.46
GOOG
$339.10
MSFT
$496.37
^RUT
$3,005.90
^FTSE
$10,823.02
AUDUSD=X
$0.718
CHF=X
$0.806
HG=F
$6.65
ETH=F
$2,504.00
No Result
View All Result
  • Home

© 2026 MarketNewsBoard | Market Analysis, Charts & News.