








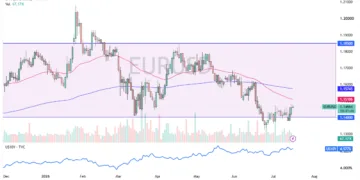



















The daily chart suggests the EUR/USD is stabilizing following two consecutive bullish sessions. The Relative Strength Index (RSI) has reclaimed the neutral 50 threshold, signaling a gradual recovery in upward momentum. However, the broader technical outlook remains neutral. Because the pair continues to trade below the Ichimoku cloud, buyers have yet to regain decisive control of the medium-term trend.
Levels to Watch
- Resistance Zone: 1.1504 & 1.1566. A clean break above these levels—and a push through the Ichimoku cloud—would validate a stronger bullish reversal.
- Support Zone: 1.1405 & 1.1349. A break below these levels would add downward pressure to the EUR/USD.
Looking ahead, next week’s ECB meeting will undoubtedly attract most of the attention. However, traders should avoid focusing solely on interest-rate guidance. If European gas prices continue to climb, markets may increasingly price in a more hawkish ECB while simultaneously becoming more concerned about the eurozone’s deteriorating growth outlook.
Conversely, any easing in geopolitical tensions that brings gas prices lower could improve the region’s growth prospects while allowing the euro to benefit from the widening policy gap with the Federal Reserve.
The key risk for euro bulls is that a prolonged energy shock eventually shifts the market’s focus away from higher interest rates and back toward recession risks. In periods of heightened geopolitical uncertainty, the U.S. dollar has historically benefited from safe-haven demand, while the United States remains considerably less vulnerable than Europe to imported energy shocks thanks to its domestic oil and gas production.
Sources: Reuters, CNBC, The Wall Street Journal, Eurostat, Fed, ECB
The information provided does not constitute investment research. The material has not been prepared in accordance with the legal requirements designed to promote the independence of investment research and as such is to be considered to be a marketing communication.
All information has been prepared by ActivTrades (“AT”). The information does not contain a record of AT’s prices, or an offer of or solicitation for a transaction in any financial instrument. No representation or warranty is given as to the accuracy or completeness of this information.
Any material provided does not have regard to the specific investment objective and financial situation of any person who may receive it. Past performance is not a reliable indicator of future performance. AT provides an execution-only service. Consequently, any person acting on the information provided does so at their own risk.
Source:
Original Article

