























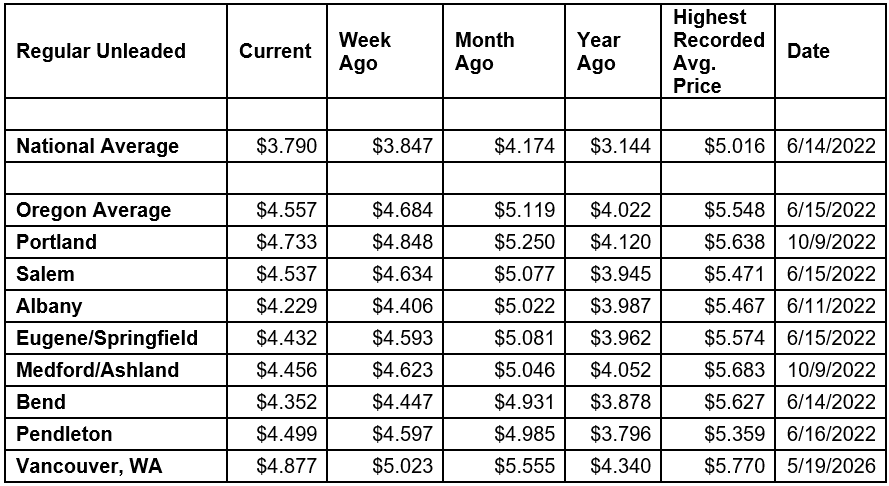
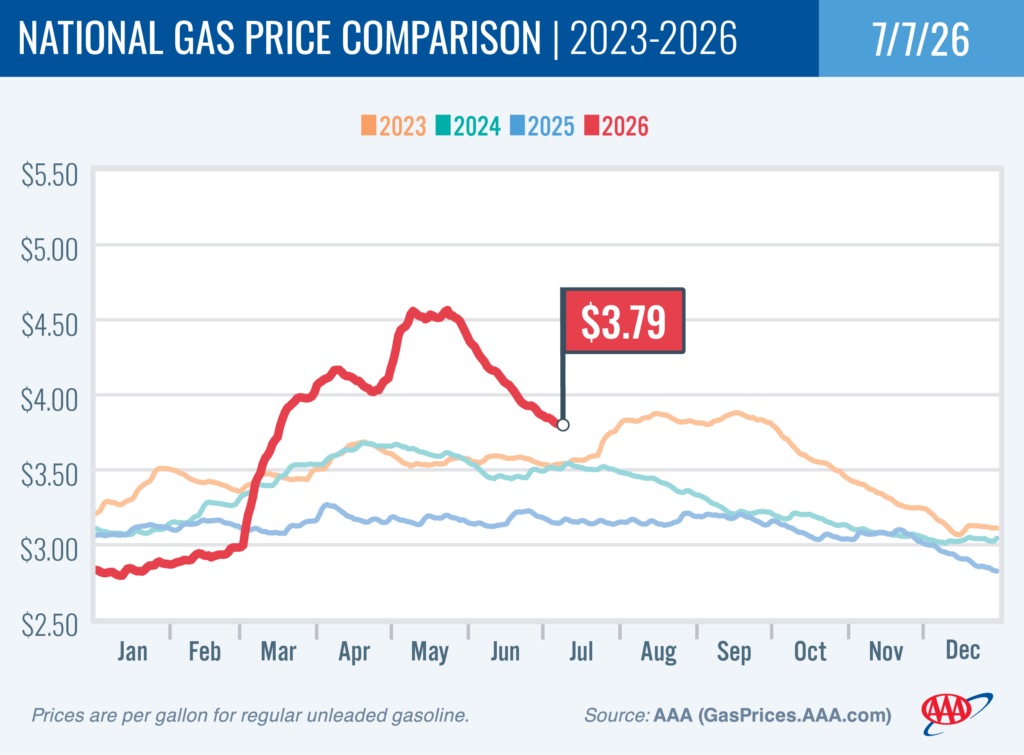
PORTLAND, Ore., – Gas prices continue to move lower this week in almost all states, including Oregon. Gas prices have fallen from year-to-date highs in May of $4.56 per gallon for the national average and $5.35 for the Oregon average, but are still 50-65 cents per gallon higher than a year ago. The decreases in pump prices are driven by cheaper crude oil prices which have fallen to their lowest levels since the start of the conflict with Iran. For the week, the national average for regular gasoline falls six cents to $3.79 a gallon. The Oregon average loses 13 cents to $4.56 a gallon.
AAA projected record travel for Independence Day with 72.2 million Americans including 877,000 Oregonians traveling 50 miles or more from home over the 4th of July holiday period. Most travelers – 85% – drove to their holiday destinations and paid the highest gas prices for Independence Day since 2022 nationally and since 2023 in Oregon. Find all the details in the AAA Independence Day travel news release.
The recent agreement between the U.S. and Iran to end the war and reopen the Strait of Hormuz sent crude oil prices sharply lower last month. Crude oil prices are again close to pre-war levels of around $70 per barrel. If the fragile peace agreement holds, crude oil prices may hold steady or even decline further. Any renewed tensions or skirmishes in the Middle East have the potential to send crude oil prices higher again.
West Texas Intermediate, the U.S. benchmark for crude, was at $67 per barrel on Feb. 27, the day before the U.S. and Israel launched strikes against Iran.
“Declining gas prices are welcome news for drivers as the summer road trip season shifts into high gear. But drivers are paying the highest summer gas prices in three or four years, depending on the location,” says Marie Dodds, public affairs director for AAA Oregon/Idaho. “Crude oil and gas prices could shift direction and move higher again if the peace process stalls.”
Gas prices remain significantly more than they were before the conflict with Iran began. The National average for regular gas was $2.98 and Oregon average was $3.92 on Feb. 28, the day the U.S. and Israel launched airstrikes against Iran.
Crude oil prices remain volatile, with dramatic swings driven by concerns of how the conflict with Iran impacts global oil supplies. Since the conflict with Iran started, prices for West Texas Intermediate, the U.S. benchmark for crude, have ranged between $71 and nearly $113 per barrel. Crude was at $67 per barrel on Feb. 27, the day before the conflict began.
In general, every $1 increase in the price of crude oil leads to a 2.4- to 2.5-cent increase in the price of gasoline.
For now, more ships are passing through the Strait of Hormuz, but current numbers are well below the 100 to 130 ships that passed through the waterway each day before the conflict began. Normally, about 20% of the world’s oil and refined products flow through the Strait of Hormuz, which is the narrow passageway of the Persian Gulf and is bordered by Iran. Tankers traveling through the Strait of Hormuz carry oil from major producers in the Middle East including Saudi Arabia, Kuwait, Bahrain, UAE, Qatar, Iraq and Iran. Any disruption in the straight can impact global oil supplies and send crude oil prices higher.
The Oregon average for regular gas began 2026 at $3.42 a gallon. The highest price of the year so far is $5.353 on May 20. The lowest price of the year so far is $3.33 on January 20. The record high for the Oregon average is $5.548 set on June 15, 2022.
The Washington average for regular gas began 2026 at $3.86 a gallon. The highest price of the year so far is $5.789 on May 20, which is the record high for Washington. The lowest price of the year so far is $3.79 on January 14.
The national average began 2026 at $2.83 a gallon. The highest price of the year so far is $4.564 on May 21. The lowest price of the year so far is $2.795 on January 11. The record high for the national average is $5.016 set on June 14, 2022.
Demand for gasoline in the U.S. gasoline increased from 8.77 million b/d to 9.13 million for the week ending June 26. This compares to 8.64 million b/d a year ago. Total domestic gasoline supply decreased from 216.3 million barrels to 214 million. Gasoline production increased last week, averaging 10 million barrels per day compared to 9.5 million barrels the previous week.
In addition to the conflict in the Middle East, pump prices are also impacted by the normal seasonal factors. Gas prices typically rise starting in mid-to-late winter and early spring as refineries undergo maintenance ahead of the switch to summer-blend fuel, which is more expensive to produce and less likely to evaporate in warmer temperatures. The switch occurs first in California, which is why pump prices on the West Coast often rise before other parts of the country. The East Coast is the last major market to switch to summer-blend fuel. Most areas have a May 1 compliance date for refiners and terminals, while most gas stations have a June 1 deadline to switch to selling summer-blend. Switch-over dates are earlier in California with some areas in the state requiring summer-blend fuel by April 1. Some refineries will begin maintenance and the switchover in February.
Gas prices usually drop in the fall, due to the switch from summer-blend to winter-blend fuel, which costs less to produce. The switch starts in September. Many areas, including Oregon, can sell winter-blend fuel starting September 15. However, Northern and Southern California require summer-blend fuel through October 31. Prices usually decline to their lowest levels of the year in late fall and early winter before increasing again in the late winter and early spring.
The U.S. price of crude oil (West Texas Intermediate) fell sharply three weeks ago to between $75 and $80 per barrel, as markets reacted to the preliminary peace deal between the U.S. and Iran. Last week, WTI was below $70 for much of the week, the lowest prices since the start of the conflict.
WTI is trading around $70 today, compared to $70 a week ago and $68 a year ago. In 2025, West Texas Intermediate ranged between $80.04 (January 15) and $57.46 (October 16) per barrel. In 2024, WTI ranged between $66 and $87 per barrel. In 2023, WTI ranged between $63 and $95 per barrel. WTI reached recent highs of $123.70 on March 8, 2022, shortly after the Russian invasion of Ukraine, and $122.11 per barrel on June 8, 2022. The all-time high for WTI crude oil is $147.27 in July 2008.
Crude prices are determined in international markets, based on global supply and demand, and are impacted by economic news as well as geopolitical events around the world including the conflict with Iran and disruptions in the Strait of Hormuz, economic uncertainty, the situation in Venezuela, tensions over Greenland, sanctions on Iran’s oil, unrest in the Middle East, the conflict between Israel and Hamas, and the war between Russia and Ukraine. Russia is a top global oil producer, behind the U.S. and Saudi Arabia.
In addition, moves by OPEC+ impact crude oil prices. Production cuts by the cartel in previous years tightened global crude oil supplies, which continued to impact prices. But in 2025, the cartel boosted production which put downward pressure on crude oil prices. For the first quarter of 2026, OPEC+ said it would not have production hikes in the first quarter of this year due to lower demand. Then oil production in the Middle East plunged due to the Iran war. However, at its meeting on March 1, OPEC+ said it would boost oil production this spring and summer; However, oil production in the Middle East plunged due to the Iran war, according to OPEC data. On Sunday, some OPEC+ countries said they would increase production by a total of 188,000 barrels per day in August.
Crude oil is the main ingredient in gasoline and diesel, so pump prices are impacted by crude prices on the global markets. On average, about 57% of what we pay for in a gallon of gasoline is for the price of crude oil, 21% is refining, 8% distribution and marketing, and 14% are taxes, according to the U.S. Energy Information Administration.
Meanwhile, crude oil production in the U.S. remains at or near record highs. The U.S. Energy Information Administration (EIA) reports that crude production in his country is at 13.81 million barrels per day for the week ending June 26. Production has been at 13.5 million barrels per day many times since October 2024. The U.S. has been the top producer of crude oil in the world since 2018 and has been increasing its oil production since about 2009.
Quick stats
Oregon is one of 48 states and the District of Columbia with lower gas prices this week. Ohio (-22 cents) has the largest week-over-week decline in the nation. Oregon (-13 cents) has the sixth-largest week-over-week decline. Hawaii (-1 cent) has the smallest decrease. Texas (+2 cents) and Iowa (+1.5 cents) are the only states with week-over-week increases.
Hawaii ($5.46) has the most expensive gas in the nation for the second week in a row. California ($5.37) is second, and Washington ($5.02) is third. These are the three states with averages at or above $5 per gallon. This week there are five states and the District of Columbia with averages at or above $4 a gallon, and 42 states have averages in the $3-range. No state has an average in the $2 range this week.
The cheapest gas in the nation is in Indiana ($3.06) and Oklahoma ($3.32). No state has had an average below $2 a gallon since January 7, 2021, when Mississippi and Texas were below that threshold. At the time, the COVID-19 pandemic drove significant declines in crude oil and gasoline demand in the U.S. and around the world.
The difference between the most expensive and least expensive states is $2.41 this week, compared to $2.29 a week ago.
All 50 states and the District of Columbia have lower prices now than a month ago. The national average is 38 cents less and the Oregon average is 56 cents less than a month ago. Arizona (-64 cents) has the largest month-over-month drop in the nation. Florida (-8 cents) has the smallest.
Oregon is one of 49 states and the District of Columbia with higher prices now than a year ago. The national average is 65 cents more, while the Oregon average is 54 cents more. Alaska (+$1.01) has the largest year-over-year jump in the nation. Delaware (+48 cents) has the smallest. Indiana (-4 cents) is the only state with a year-over-year decline.
West Coast
The West Coast region continues to have the most expensive pump prices in the nation with six of the seven states in the top 10. It’s typical for the West Coast to have six or seven states in the top 10 as this region tends to consistently have fairly tight supplies, consuming about as much gasoline as is produced. In addition, this region is located relatively far from parts of the country where oil drilling, production and refining occurs, so transportation costs are higher. And environmental programs in this region add to the cost of production, storage and distribution.
As mentioned above, Hawaii has the most expensive gas in the country. California, Washington, Alaska, Oregon, and Nevada round out the top six. Arizona is 13th. Oregon is fifth most expensive for the sixth week in a row.
All seven states in the West Coast region have week-over-week decreases in their average pump prices this week. Washington (-14 cents), Oregon (-13 cents), Alaska (-10 cents), Arizona (-9 cents), Nevada (-8 cents), California (-6 cents), and Hawaii (-1 cent).
The refinery utilization rate on the West Coast slips from 94.2% to 93.7% for the week ending June 26. This rate has ranged between about 71% to 94% in the last year. The latest national refinery utilization rate ticked up from 96.1 to 96.6%.
The refinery utilization rate measures how much crude oil refineries are processing as a percentage of their maximum capacity. A low or declining rate can put upward pressure on pump prices, while a high or rising rate can put downward pressure on pump prices.
According to EIA’s latest weekly report, total gas stocks in the region increased from 28.91 million bbl. to 29.17 million bbl. for the week ending June 26. An increase in gasoline stocks can put downward pressure on pump prices, while a decrease in gasoline stocks can put upward pressure on pump prices.
Oil market dynamics
Crude oil prices have fallen to pre-war levels due to the fragile cease fire between the U.S. and Iran. However, oil prices moved higher today following reports of an Iranian attack on commercial ships in the Strait of Hormuz. Oil prices have seen significant ups and downs since the start of the Iran conflict, as markets react to the daily developments in the Middle East.
Meanwhile, the EIA reports that crude oil inventories decreased by 3.8 million barrels from the previous week. At 408.4 million barrels, U.S. crude oil inventories are about 7% below the five-year average for this time of year.
U.S. markets were closed on Friday, July 3 in observance of Independence Day. At the close of Monday’s formal trading session on the NYMEX, WTI slipped 14 cents to settle at $68.55. Today crude is trading around $70, compared to $70 a week ago. Crude prices are about $2 more than a year ago. ($67.93 on July 7, 2025)
Drivers can find current gas prices along their route with the free AAA Mobile app for iPhone, iPad and Android. The app can also be used to map a route, find discounts, book a hotel and access AAA roadside assistance. Learn more at AAA.com/mobile.
Diesel
Diesel prices are lower in all 50 states and the District of Columbia this week. Colorado (-22 cents) has the largest week-over-week decrease. New Jersey (-2 cents) has the smallest.
For the week, the national average falls nine cents to $4.77 a gallon. The record high is $5.816 set on June 19, 2022.
The Oregon average drops 12 cents to $5.36. The record high is $6.47 set on July 3, 2022.
A year ago the national average for diesel was $3.68 and the Oregon average was $4.47.
Find current fuel prices at GasPrices.AAA.com.
AAA news releases, high resolution images, broadcast-quality video, fact sheets and podcasts are available on the AAA NewsRoom at NewsRoom.AAA.com.
Find local news releases at https://oregon.aaa.com/community/media/media-contacts.html
Fuel prices are updated daily at AAA’s Daily Fuel Gauge at AAA Fuel Prices. For more info go www.AAA.com. AAA Oregon/Idaho provides more than 917,000 members with travel, insurance, financial and automotive-related services, and is an affiliate of AAA National, serving more than 65 million members in North America.
Source: Original Article