


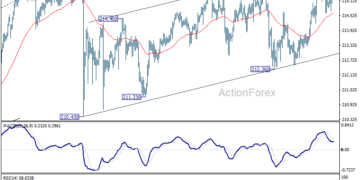


Now, strong support remains at 7,000 to 7,200, which is considered a strong buy zone for investors. But the index has now formed a triangle pattern in June, which indicates price compression. This triangle pattern indicates that a break above 7,600 will likely trigger strong upside move in the S&P 500 in July 2026.
But a break below 7,300 will likely push the index towards the 7,000 to 7,200 area, which is considered a buy zone for the index.
The short-term price action also shows that the S&P 500 is constructing a strong bullish pattern. On one hand, the index is forming a triangle pattern by consolidating from the June 3 highs towards the recent highs. A break above 7,600 will indicate a strong surge in the index towards 8,000.
On the other hand, if the index drops towards 7,200, this will likely act as a bull flag pattern. This correction will likely trigger another move towards the 8,000 level as a strong rally.
But the RSI remains above the mid-level, which indicates that any correction in the S&P 500 will likely strengthen the next move in the S&P 500.
Source: Original Article


