














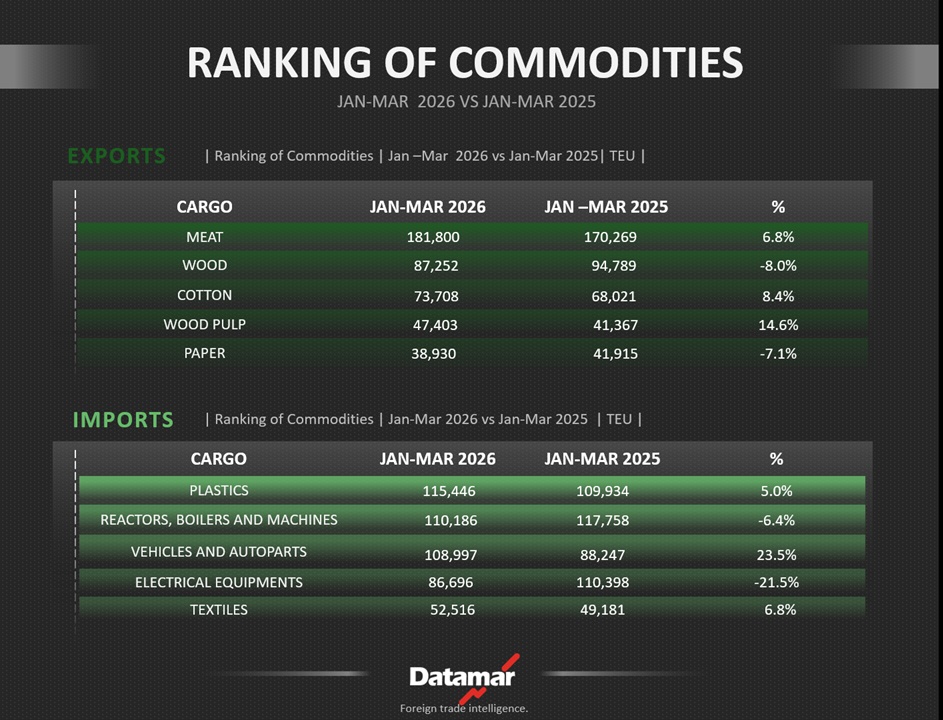
See below the ranking of the main commodities handled by Brazil, Argentina, Paraguay, and Uruguay in the first quarter of 2026, compared with the same period last year. The data were compiled using DataLiner information.
Brazil’s containerized export ranking in the first months of 2026 was led by meat products, whose volumes were 6.8% higher than in the same period last year, followed by wood, whose shipments fell 8%, and cotton, whose volumes increased 8.4%. See below:
Commodities Ranking | Dataliner Brazil | Jan-Mar 2026 vs. Jan-Mar 2025 | TEU | Exports
Source: DataLiner (click here to request a demo)
Plastics led Brazil’s containerized import ranking in the first three months of 2026, with volumes 5% higher than in the same period last year, followed by reactors, boilers, and machinery, whose shipments declined 6.4%, and vehicles and auto parts, with volumes increasing 23.5%. See below:
Commodities Ranking | Dataliner Brazil | Jan-Mar 2026 vs. Jan-Mar 2025 | TEU | Imports
Source: DataLiner (click here to request a demo)
Vegetables were Argentina’s top-exported product category in the first three months of 2026, with volumes 42.4% higher than in the same period last year, followed by meat products, up 5.2%, and seafood, whose shipments increased 42.1%. See below:
Commodities Ranking | Dataliner Argentina | Jan-Mar 2026 vs. Jan-Mar 2025 | TEU | Exports
Source: DataLiner (click here to request a demo)
Argentina’s containerized import ranking from January to March 2026 was led by reactors, boilers, and machinery, although volumes were 20.8% lower than in the same period last year. These were followed by vehicles and auto parts, whose shipments declined 9.7%, and by plastics, whose volumes declined 2.7%. See below:
Commodities Ranking | Dataliner Argentina | Jan-Mar 2026 vs. Jan-Mar 2025| TEU | Imports
Source: DataLiner (click here to request a demo)
Commodities Ranking | Dataliner Paraguai e Uruguai | Jan-Mar 2026 vs. Jan-Mar 2025 | TEU | Exports
Source: DataLiner (click here to request a demo)
The containerized import ranking of Paraguay and Uruguay was led by vehicles and auto parts, with volumes 33.3% higher than in the same period last year, followed by reactors, boilers, and machinery, whose inbound shipments increased 6%, and electrical equipment, with volumes rising 23.6%. See below:
Commodities Ranking | Dataliner Paraguai e Uruguai | Jan-Mar 2026 vs. Jan-Mar 2025| TEU | Imports
Source: DataLiner (click here to request a demo)