









Published: 07-10-2026, 03:15 pm | Updated: 07-10-2026, 04:35 pm
Key Takeaways
- Gold set an all-time high of $5,589.38 in January 2026 and corrected roughly 26% over the following months — a drawdown that sits comfortably within the historical range of mid-cycle bull market corrections.
- An unrealized loss is not a final loss. The only way to lock in a loss is to sell.
- Three strategic paths are available: hold patiently, dollar-cost average at lower prices, or sell to harvest a tax loss and immediately repurchase (physical metals are exempt from wash sale rules).
- The Gold-to-Silver Ratio currently sits near 69:1, inside its long-term average range of 60–70:1, which makes neither metal dramatically mispriced relative to the other at this moment.
- Every significant gold bull market in modern history has included corrections of 15–47%. In every case, the underlying monetary thesis proved correct over the full cycle.
Gold hit an all-time high of $5,589.38 per ounce in January 2026, then corrected roughly 26% over the following months. [World Gold Council, LBMA] If you bought near that peak — or near any cyclical high — you are looking at a paper loss right now, and that paper loss feels very real.
It is not a final loss yet. Not unless you sell.
This guide is for the investor who bought gold or silver near a market top and is now trying to think clearly about what to do next. It covers how to assess your actual situation, what three strategic paths are genuinely available to you, how the Gold-to-Silver Ratio factors in, and why the structural case for owning physical metal has not changed. The January 2026 correction serves as the working example throughout — the mechanics apply to any cycle.
Where Do You Actually Stand? The Diagnostic Every Top-Buyer Needs
The gut reaction after watching an investment drop 20-plus percent is to check the price every few hours. That is the wrong unit of measurement. Before you make any decision, you need three real numbers.
Your true average cost basis. If the January purchase was not your only gold purchase, your average cost is lower than the ATH. An investor who bought $5,000 worth of gold at $3,500 in mid-2025 and another $5,000 at $5,589 ends up with a blended cost of roughly $4,545. That is already much closer to today’s price than the headline loss suggests. Add up what you have actually spent. Divide by the total ounces you hold. That is your real break-even.
Your concentration. Most financial advisors and gold strategists suggest keeping precious metals to 5–15% of a total portfolio. If your gold position is within that range, a 26% drawdown in that one sleeve is painful but not structurally threatening to your overall financial picture. If you went heavier than that, concentrating 25% or 40% of your net worth into gold near a historical peak, that is a different conversation, and this guide will address it directly.
Your liquidity position. Physical gold is an illiquid asset by design. If you might need the money in the next 12–18 months to pay bills, cover a business shortfall, or handle a major life expense, that matters enormously for the decision you make. Forced sellers never get good prices. The first question to answer honestly: could you leave this position alone for three years without touching it?
The Knowledge That Changes Everything
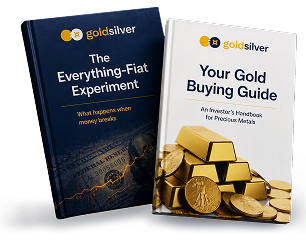
2 Free Guides
Two essential guides — yours free. Understand why gold matters and why fiat currencies always fail.
What Are Your Three Strategic Paths After Buying Gold at the Top?
Should You Just Hold and Wait?
The simplest path is also the most psychologically demanding. You lock the metal in storage, stop looking at the daily price, and give the thesis time to play out.
This is not passive inaction. It is a deliberate, active choice to hold a position you researched and believed in, made on the basis that short-term price movements do not change long-term monetary reality.
The historical case for patience is strong, and the data is compelling. Every meaningful gold bull market in modern history has included sharp mid-cycle corrections. During the 1970s bull run, gold endured five separate corrections exceeding 15%, including a 47% decline between 1974 and 1976, before going on to deliver 2,329% total returns by 1980. [Federal Reserve historical data] During the 2001–2011 bull market, corrections of 15–20% occurred roughly every 18–24 months, and the 2008 financial crisis produced a 34% drop. [Gold price cycle analysis] In every case, investors who sold during the panic missed the recovery. In every case, the monetary conditions that drove gold higher in the first place remained intact.
The current 26.6% correction is consistent with a mid-cycle consolidation. [Discovery Alert, Gold Silver Correction Bottom analysis, June 2026] As the World Gold Council’s mid-year 2026 report noted, gold is trading broadly in line with the global backdrop of moderate growth, cooling but still elevated inflation, and expectations of further limited central bank tightening. [World Gold Council, Gold Mid-Year Outlook 2026]
What Are the Trade-offs of Holding?
The trade-off with holding is real, however. Your capital is tied up and unavailable for other uses. If the correction deepens further before it reverses, you will watch the paper loss grow before it shrinks. The 200-day moving average sits near $4,340 and acts as the first technical resistance level above current prices. [J.P. Morgan Commodities Research, July 2026] A sustained close above that level would be the first signal that the technical picture is improving.
Hold works best when: you have a position sized within a healthy allocation. You have liquidity elsewhere to cover near-term needs, and the original reasons you bought gold have not materially changed.
Does Dollar-Cost Averaging Lower Your Break-Even Price?
Yes. For many investors sitting on top-of-market purchases, this is the most mathematically powerful option on the table.
Dollar-cost averaging means buying additional gold at the current lower price, deliberately lowering your average cost per ounce. Consider a straightforward example. An investor who purchased one ounce at the January peak of $5,589 and now purchases one additional ounce at $4,102 has a blended cost of $4,845 per ounce. That is more than $740 lower than the original purchase price, achieved without any timing skill, simply by buying more during the correction.
For an equal-dollar comparison: an investor who spent $5,000 near the January peak acquired roughly 0.89 ounces. Spending another $5,000 at $4,102 acquires roughly 1.22 ounces. The blended average cost across both purchases is about $4,732 per ounce. [goldsilver.com/price-charts/, July 10, 2026]
This strategy works particularly well in a confirmed bull market because it aligns two forces: the structural thesis that drove you to own gold in the first place, and a better entry price. Dollar-cost averaging does not require you to call the bottom. It removes the timing problem entirely by spreading purchases across multiple price levels. [GoldSilver, When Is the Best Time to Buy Gold?]
The honest trade-off here: you are committing additional capital to a position that is currently losing. If the correction continues — and it might — you will experience further paper losses on the new purchase before the strategy proves itself. This path requires both the additional capital and the patience to hold through further volatility.
Dollar-cost averaging works best when: you have additional capital you can genuinely afford to put to work, you remain confident in the structural thesis, and you can commit to holding the new purchase for at least 18–24 months.
What Is Tax-Loss Harvesting, and Does It Apply to Physical Gold?
Tax-loss harvesting is the practice of selling a position that has declined below your purchase price, realizing the loss on paper, and using that loss to offset capital gains elsewhere in your portfolio: stocks, real estate, or cryptocurrency, for example.
For most physical gold investors with top-of-market purchases, this strategy creates a real tax benefit right now, because the current price is below the purchase price for anyone who bought gold above $4,102.
First, here is how the tax mechanics work: the IRS classifies physical gold and silver as collectibles under Internal Revenue Code Section 408(m). Long-term gains on collectibles — held more than one year — are taxed at a maximum federal rate of 28%, which is higher than the 15–20% maximum rate on most stock gains. Short-term gains are taxed at ordinary income rates. [IRS IRC Section 408(m); LegalClarity, How to Sell Gold and Silver Tax-Free, March 2026]
Importantly, the critical advantage for harvesting losses in physical metals is this: the wash sale rule does not apply. Under the wash sale rule for securities, if you sell a stock at a loss and repurchase the same or a substantially identical security within 30 days before or after the sale, the IRS disallows the loss. That rule applies only to stocks and securities. Physical gold, silver, and other precious metals are explicitly excluded from IRC Section 1091. You can sell your gold coins or bars at a loss today, immediately repurchase the identical metal, and still claim the full tax loss. [Kiplinger, All That Glitters Is Usually Taxable; Accounting Today, February 2026]
A Real-World Tax-Loss Example
In practice, this means a top-of-market buyer who purchased gold at $5,589 and sells today at $4,102 realizes a taxable loss of roughly $1,487 per ounce. If they hold, say, a stock portfolio that realized $15,000 in capital gains this year, that precious metals loss can offset those gains directly, which saves real dollars on the April tax bill. And because the wash sale rule does not apply, they can buy the same metal back immediately, maintaining their physical position while banking the tax benefit.
One important caution: tax-loss harvesting involves selling your physical metal, which means dealer spreads, shipping, and storage logistics. The transaction costs eat into the tax benefit. For smaller positions, the costs may outweigh the savings. This strategy is most effective for investors in the 32% bracket or higher, or those with substantial capital gains elsewhere that need offsetting.
Tax-loss harvesting works best when: you have significant capital gains from other assets to offset, you are in a higher income tax bracket, and you can execute the sale and repurchase efficiently.
Is Silver a Better Bet Right Now? Reading the Gold-to-Silver Ratio
The Gold-to-Silver Ratio measures how many ounces of silver it takes to buy one ounce of gold. As of July 10, 2026, that ratio sits at about 69:1: one ounce of gold buys about 69 ounces of silver. [goldsilver.com/price-charts/]
To put that in context: the ratio reached 125:1 during the COVID liquidity crisis in March 2020, meaning silver was extraordinarily cheap relative to gold at that moment. During the gold bull market of early 2026, the ratio compressed to 50:1 in late January as silver surged alongside gold. [GoldSilver, Gold-to-Silver Ratio Explained] The long-term modern average hovers around 60–70:1. [preciousmetalprices.com, July 2026]
At 69:1, silver is at the higher end of its historical average range. It is not the screaming buy signal that 90:1 or 100:1 represents. But it does suggest that silver has not dramatically outperformed gold during the recent correction period. The two metals have largely fallen together.
Silver offers genuine structural attractions right now. The Silver Institute projects a sixth consecutive annual global supply deficit for 2026, estimated at about 46.3 million ounces. [Silver Institute, World Silver Survey 2026] Industrial demand from solar photovoltaic manufacturing, electric vehicles, and AI infrastructure hardware continues to grow. Silver’s industrial use accounts for roughly 58% of total silver demand. [Silver Institute, World Silver Survey 2026]
What Is the Volatility Risk of Switching to Silver?
The volatility warning is also genuine. Silver moves faster than gold in both directions. During the 2026 correction, silver fell harder than gold on a percentage basis before partially recovering. That is not a design flaw. It is the nature of a smaller, more thinly traded market where the same capital flows create larger price swings. Investors who can tolerate wider short-term swings may find silver interesting at current prices and the current ratio. Investors who are already stretched by watching gold fall 26% should be honest with themselves about whether adding silver volatility helps or hurts.
The ratio-based rebalancing strategy (swapping some gold for silver when the ratio is high, then swapping back when it compresses) requires patience measured in months or years, not days. At 69:1, the ratio has compressed significantly from its correction-period highs but remains above the 50:1 level that historically marks silver outperformance territory. [GoldSilver, Silver Price Outlook June 2026]
Has the Fundamental Case for Gold Changed?
This is the only question that actually matters for long-term holders.
The reasons most people buy gold are structural, not tactical. They buy because governments run persistent fiscal deficits that require monetary accommodation. Or because central banks have demonstrated a willingness to expand money supply in response to economic stress or buy because the purchasing power of fiat currencies erodes over time, and physical metal cannot be diluted by a vote in a committee room.
Have any of those structural conditions changed since January 2026? The evidence says no.
The European Central Bank confirmed in June 2026 that gold has overtaken US Treasuries as the world’s largest reserve asset, a milestone for the de-dollarization and monetary debasement thesis that underpins the structural case for gold. [European Central Bank, June 2026] Central banks purchased a net 244 tonnes of gold in the first quarter of 2026. This was above the five-year average, at near-record prices. [World Gold Council, Gold Demand Trends Q1 2026] The People’s Bank of China increased its monthly purchase pace from roughly one tonne per month through February 2026 to eight tonnes in April. [J.P. Morgan Global Research, Gold Prices 2026 and 2027]
What did change was the cyclical picture. Gold’s January spike was partly a geopolitical risk premium driven by Iran-related tensions and safe-haven urgency. When those tensions appeared to de-escalate and equity markets recovered, gold gave back the reactive portion of its gains. ING commodities strategist Ewa Manthey described the correction as driven “primarily by cyclical macroeconomic headwinds rather than a deterioration in gold’s structural fundamentals.” [ING, Forecast Reset note, June 2026]
What Do Major Institutions Forecast for Gold Right Now?
Short-term direction depends on factors that are genuinely uncertain: whether the Federal Reserve raises rates in September, whether Iran-US tensions re-escalate, whether the equity rally continues or stalls. Major institutions continue to see gold higher over the medium term. J.P. Morgan has revised its Q4 2026 target to about $4,500 per ounce, Goldman Sachs targets $4,900 by year-end, and ING forecasts $4,600 average in Q4 2026. [J.P. Morgan Global Research; Goldman Sachs; ING, 2026] None of those forecasts are guarantees. What they represent is the institutional consensus that the structural case has not broken.
The gold bull market cycles framework holds: every significant correction in a secular bull market feels, in the moment, like the end of the bull market. The 1974 correction felt like the end. The 2008 correction felt like the end. Neither was. Investors who kept checking price charts instead of checking structural fundamentals made worse decisions in both cases.
The Long Game: Sound Money Is Measured in Decades
Gold is not designed to be a trading vehicle. It is not designed to make you feel good over a six-month window. It is designed to preserve purchasing power across decades, the timeframe over which currency debasement becomes visible to the naked eye.
As a result, the correct unit for measuring a precious metals position is ounces, not dollars. You own a specific number of ounces of a finite physical asset that cannot be printed, replicated, or diluted. The dollar price of those ounces fluctuates. The ounces themselves do not.
From that lens: a 26.6% correction in fiat-denominated price is real, and it is not comfortable to sit through. It does not change how many ounces you own, and it does not change what those ounces represent. Consequently, the mechanism that causes gold to rise over long time horizons has not been repealed. That mechanism is the steady expansion of money supply relative to the supply of physical metal. It is running in the background every day, regardless of what Jerome Powell’s successor at the Federal Reserve says about September rate policy.
Why Ounces Matter More Than Price
Sound investing in precious metals is boring. You learn why the monetary system works the way it does, and buy physical metal as a percentage of your savings. Then you stop looking at the price every day and wait years, not months. You review your allocation annually and rebalance when it drifts significantly.
In summary, the investors who fare best in precious metals are the ones who understood the thesis deeply enough to hold through the inevitable corrections, and who sized their positions carefully enough that they never needed to sell at the wrong moment.
Stay On Top of Gold & Silver Prices
Get important market alerts sent straight to your inbox.
People Also Ask
What should I do if I bought gold at the all-time high?
Start with the diagnostic: calculate your true average cost basis across all your gold purchases, check whether your position is within a healthy allocation (typically 5–15% of total portfolio), and confirm you have sufficient liquidity elsewhere to avoid forced selling. From there, three paths are available: hold patiently (the structural case has not changed), dollar-cost average at lower prices to bring your break-even down, or sell to harvest a tax loss and immediately repurchase. The right path depends on your liquidity, tax situation, and conviction in the underlying thesis.
How long does it typically take for gold to recover after a major correction?
Recovery timelines vary significantly. During the 2001–2011 bull market, corrections of 15–20% typically resolved within 12–24 months before gold set new highs. The 2008 crisis — a 34% decline — resolved within about three years as gold reached new records by September 2011. The 47% mid-cycle correction of 1974–1976 took roughly four years to fully recover before the 1980 peak. These timelines assume the structural drivers of the bull market remain intact, and as of mid-2026, they do by most analytical measures.
Does dollar-cost averaging work for gold?
Yes, with important caveats. Dollar-cost averaging lowers your average cost per ounce when you buy additional metal at prices below your original purchase. It works best in an established bull market where you expect higher prices over a multi-year horizon. Further, it requires additional capital you can genuinely afford to leave in the position for 18–24 months or more, and it requires the conviction to continue buying during periods of further price weakness. It does not require calling the bottom. That is the point.
Can I claim a tax loss on physical gold without triggering the wash sale rule?
Yes. The wash sale rule under IRC Section 1091 applies only to stocks and securities. Physical gold, silver, and other precious metals are explicitly excluded. You can sell your physical gold at a loss today and immediately repurchase the identical metal (coins, bars, or any form) without affecting the deductibility of the loss. This makes tax-loss harvesting in physical metals significantly more flexible than the equivalent strategy in equities. Consult a qualified tax professional to confirm how the rule applies to your specific holdings and tax situation.
Is the Gold-to-Silver Ratio a good signal right now?
At about 69:1 as of July 10, 2026, the ratio sits near the higher end of its long-term average range of 60–70:1. This is not an extreme signal in either direction. Ratios above 80:1 have historically suggested silver is significantly undervalued relative to gold; ratios below 50:1 have historically suggested gold is undervalued relative to silver. At 69:1, silver is modestly cheaper than gold on a relative historical basis, but not by a dramatic margin. Investors who want to rebalance toward silver can do so with a reasonable valuation rationale; those who prefer to hold their current gold position can do so without missing an obvious mispricing.
What is the most important thing to check before deciding what to do with a losing gold position?
Ask whether the reasons you bought gold have changed. Not whether the price has changed. If you bought because monetary debasement erodes purchasing power over time, check whether governments are running smaller deficits and central banks are shrinking their balance sheets. If you bought because of central bank reserve diversification away from the dollar, check whether that trend has reversed. As of mid-2026, neither of those things has happened. The ECB confirmed gold overtook US Treasuries as the world’s largest reserve asset in June 2026. Central banks bought 244 tonnes in Q1 2026 at near-record prices. The mechanism that drives gold over multi-year horizons is intact. The price correction is a cyclical event. The structural case is not.
SOURCES
1. World Gold Council — Gold Mid-Year Outlook 2026; Gold Demand Trends Q1 2026
2. LBMA — Precious Metal Prices & Historical Benchmark Records
3. IRS — Topic No. 409, Capital Gains and Losses; Internal Revenue Code Section 408(m); IRC Section 1091 (wash sale rule)
4. J.P. Morgan Global Research — Gold Price Predictions for 2026 and 2027 (Q4 2026 target revised to ~$4,500)
5. Silver Institute — World Silver Survey 2026 (annual supply deficit data, industrial demand share)
6. European Central Bank — The International Role of the Euro, June 2026
7. ING — Gold’s Correction Prompts a Forecast Reset, June 2026 (Ewa Manthey, commodities strategist)
8. GoldSilver — Gold Price Cycles & Market Trends; Gold-to-Silver Ratio Explained; When Is the Best Time to Buy Gold?
9. GoldSilver Price Charts — goldsilver.com/price-charts/ (live spot prices, July 10, 2026, 18:07 UTC)
10. LegalClarity — How to Sell Gold and Silver Tax-Free: IRS Strategies, March 2026
11. Kiplinger — All That Glitters Is Usually Taxable: Gold and Silver Tax Rules
12. Accounting Today — Beware of Tax Implications of Selling Precious Metal, February 2026
13. CBS News — What Is the Highest Gold Price in History? (gold ATH $5,589.38, January 28, 2026)
14. Goldman Sachs Global Investment Research — Precious Metals Outlook 2026 (year-end $4,900 target)
15. Federal Reserve — Historical monetary policy data (gold bull market context, 1970s)
Disclaimer: This article is for informational purposes only and does not constitute financial or investment advice. Always consult a qualified financial adviser before making investment decisions.
You May Also Like:
Source: Original Article