

























TradingKey – Apple Inc. (AAPL) is currently trading at $311.04 and is taking a breather within a symmetrical triangle on its 4-hour chart, though a double top pattern is forming just below its highest level in the past 52 weeks at $317.39. The RSI has now reached 70.73. The indicator is creeping towards overbought and there are some initial hints that momentum may slow down. Jefferies thinks Apple stock may trade in a range in the near term.
The good news was that Apple has reportedly extended its contract with Broadcom (AVGO) up to 2031 to make and sell custom ASIC chips to the iPhone maker. After news of the deal, Broadcom shares were up 3.7% and Apple shares were up ~1% on July 6.
The bad news is Kuo claimed that production of Apple’s upcoming foldable iPhone (dubbed the iPhone Ultra) is going at a more gradual pace compared to expectations. Supply chain sources estimate 500,000 units to 1 million units in Q3 2026, and 7 million to 8 million units in H2, which is less than an expected 10 million unit ramp rate. The slower ramp rate has been linked to the troubles Apple faced with the iPhone X in 2017. Apple’s next event to watch out for is the Q3 earnings release on July 30.
Broadcom Partnership Extended Until 2031
That agreement will extend Apple’s cooperation with Broadcom through 2031 and cover the development and supply of custom ASIC chips. That’s one way for Apple to be more involved with the design, supply, and cost of chips that it uses while ensuring that connectivity, wireless, and custom logic chips are available for the next several iPhone products.
It is also a sign that Apple isn’t looking for a new company to provide all of the chips for those products, even as it continues its search for new memory component suppliers and manufacturing partners.
Broadcom shares rose 3.7%, as investors anticipated the company to continue doing long-term business with one of its biggest clients. On the other hand, Apple’s supply chain risk reduces while memory cost remains a margin headwind in the coming quarters.
iPhone Foldable Production Ramp Remains a Risk
The main short-term concern is from Kuo. Apple could ship 7 to 8 million foldable iPhones in H2, 500,000 to 1 million in Q3, compared to the company’s production target of 10 million units, Kuo said. Kuo cited the comparison to the iPhone X, when manufacturing constraints delayed shipments despite the product being unveiled on schedule.
Apple may also announce the iPhone foldable launch on schedule, but sell fewer than investors expect, particularly in the holiday quarter, if a slower production ramp rate occurs, as he told clients. That may be why Jefferies says Apple may trade in range in near term.
The stock is near a 52-week high at $311, and the average analyst target is at this price point. Investors are awaiting the earnings call for guidance on the iPhone production ramp, margins, and demand on the back of iPhone demand for the July 30 call.
AAPL Technical Setup: Double Top at $317, RSI 70, Short to $289.90
On the 4H timeframe we see Apple forming a double top in the 52w high area of $317. Uptrend line from previous higher lows is providing support. RSI at 70.73 seems overbought as do distribution and tapering volume within this triangle structure. Double top $317 projected to $289 to $272 on downside break. If AAPL trades below $300.30 targets $289.90. Stop placed above $317.30. If AAPL does break and confirm above $317.30 then $329.
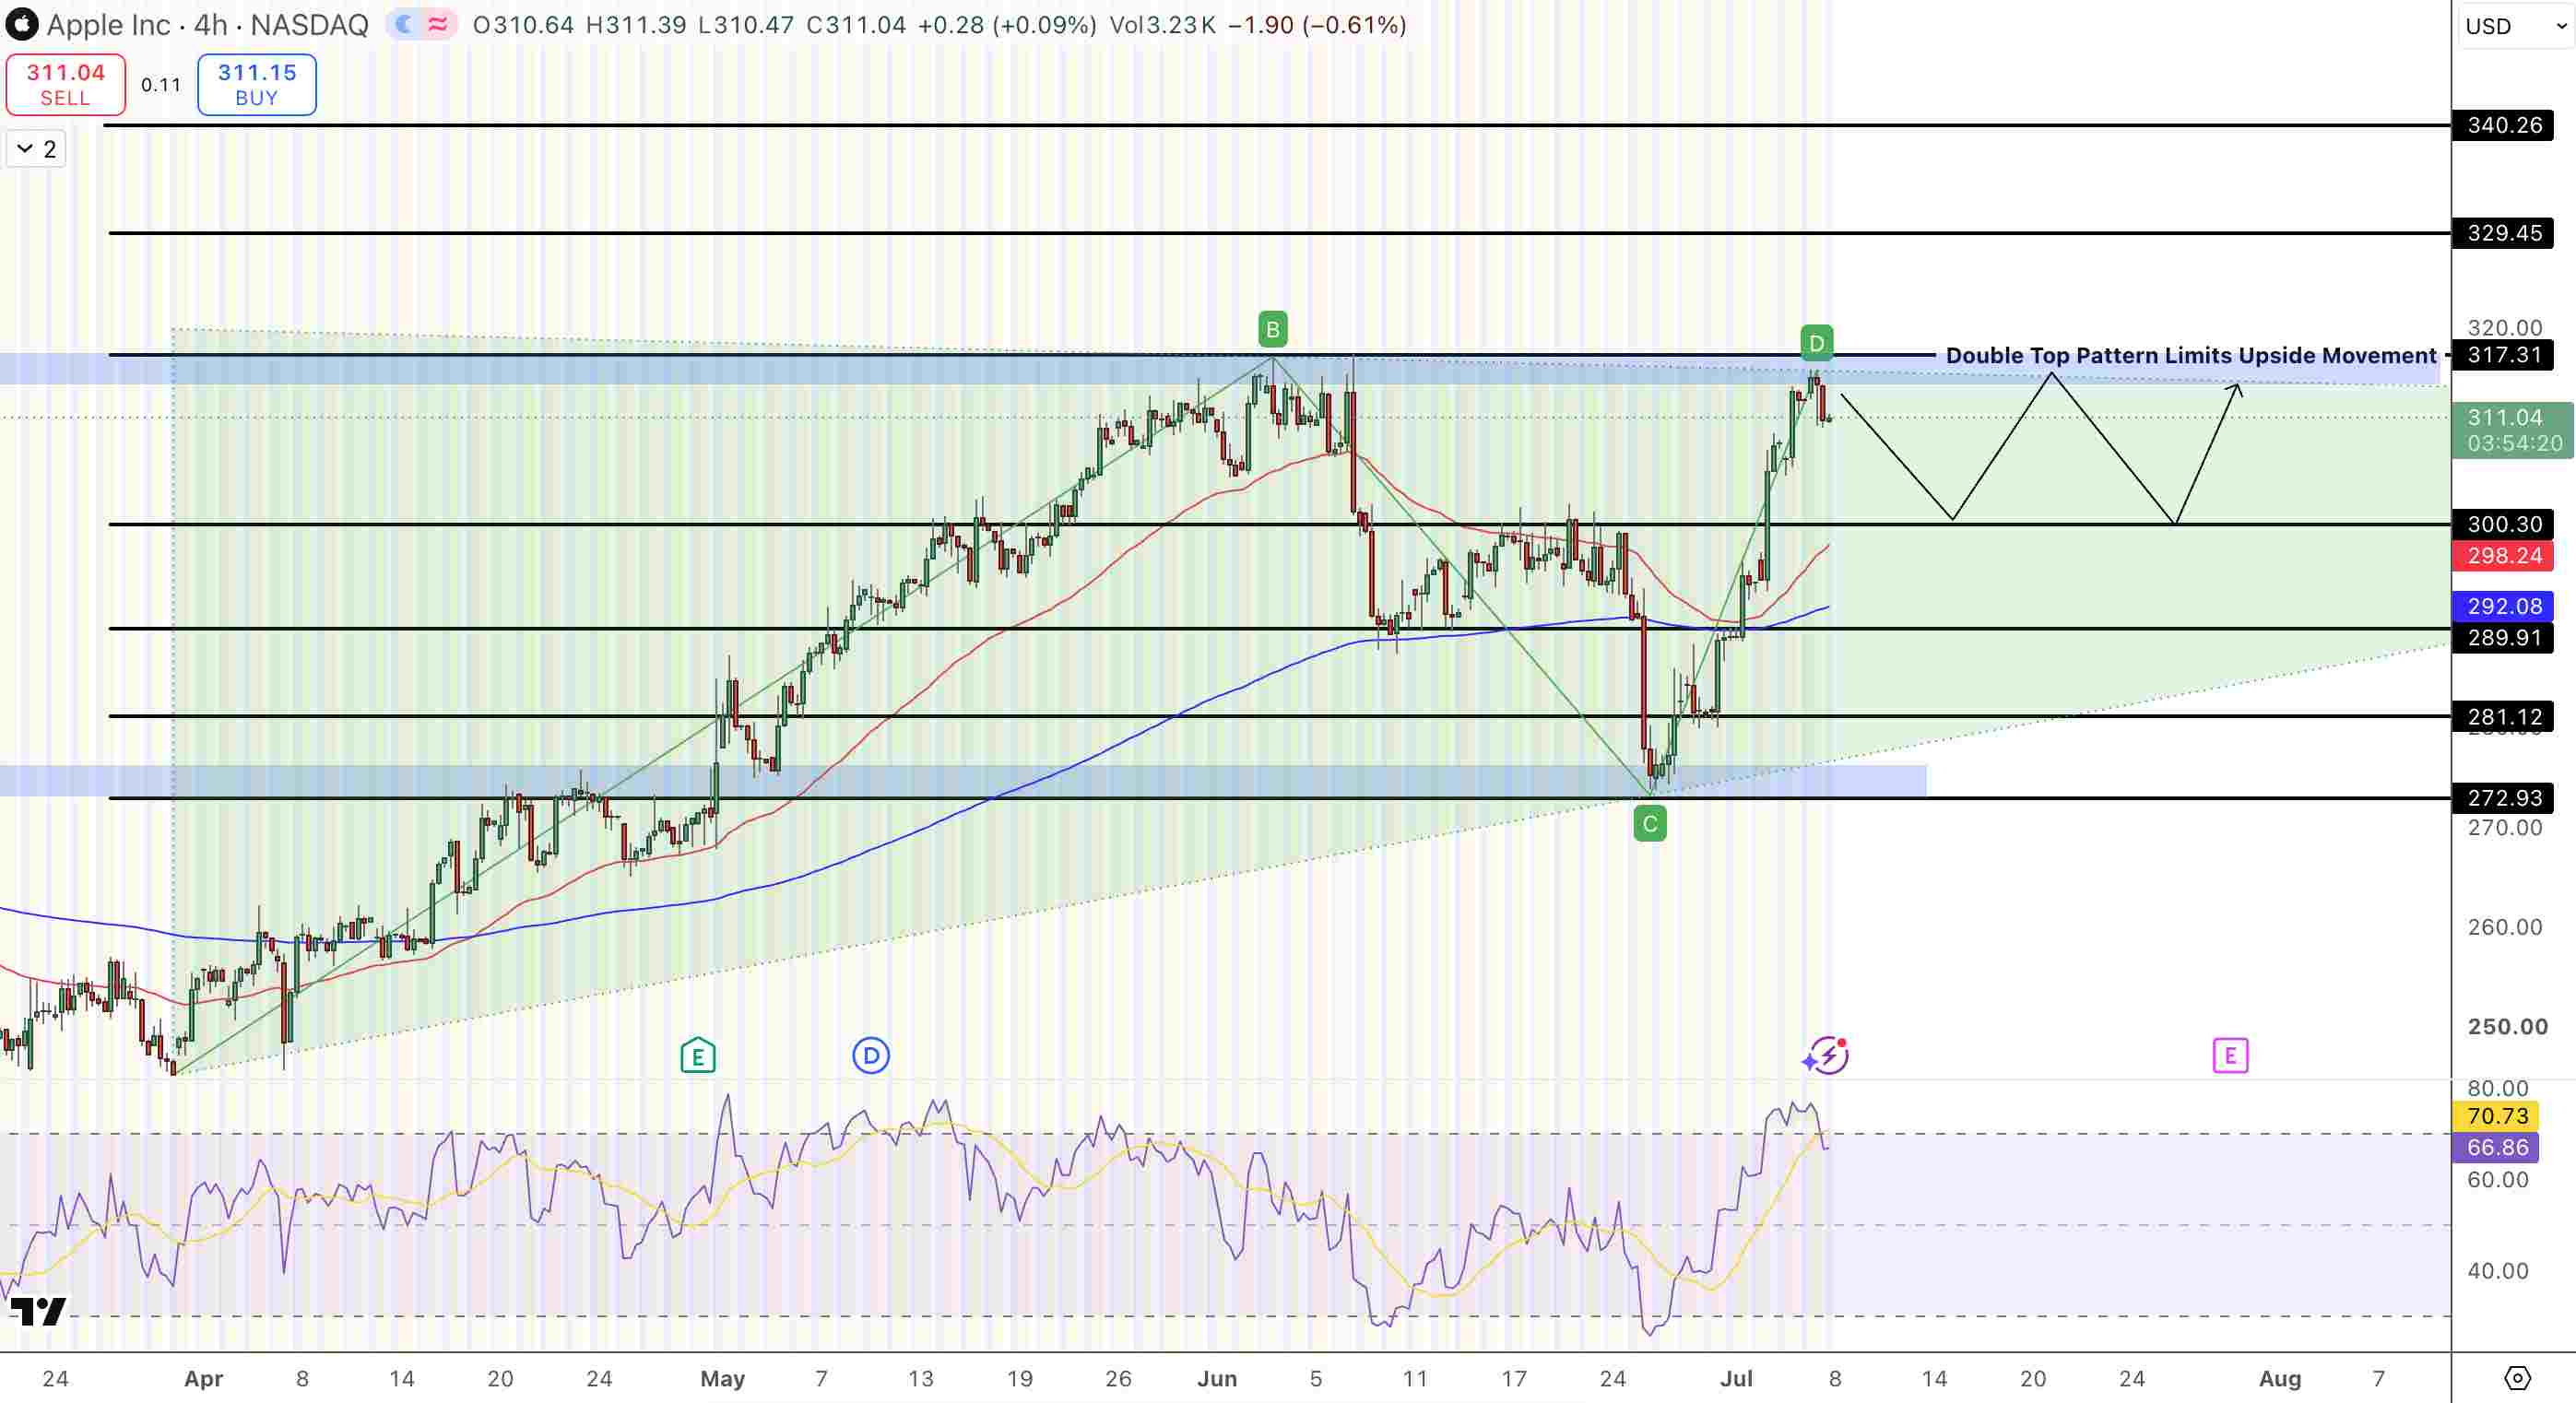
- Short entry: Below $300.30, Double top breakdown is confirmed
- Target: $289.90, Double top measured move
- Stop loss: Close above $317.30, Double top invalid, Triangle breaks out up
- Broadcom deal: Extended into 2031 for custom ASIC silicon, supply chain security positive
- Foldable risk: Kuo: 500K to 1M units Q3, 7 to 8M total H2. iPhone X parallel called out
- Q3 earnings: July 30, 2026, gross margin, iPhone 18 guide, Foldable launch timing
Why Is Apple Building A Double Top At $317?
Apple just achieved a 52-week high at $317.39 and is now consolidating within a symmetrical triangle, with a double top pattern on the top border. At 70.73 the RSI seems like it could become overbought and the analyst consensus target prices of approximately $315.09 at Jefferies have deemed that the stock is “potentially range bound in the near term,” which places the analyst consensus target prices of approximately $315.09, essentially at the current stock price, with no significant upside-to-consensus gap. The three forward looking uncertainties, foldable production ramp, memory cost trajectory, and July 30 Q3 earnings guidance, are causing the distribution that we are seeing on the chart at the 52-week high zone.
What Is the Foldable iPhone Delay Risk Ming-Chi Kuo Identified?
Kuo’s supply chain research pegs Q3 2026 production at only 500,000 to 1 million units, with 7 to 8 million total through H2 2026, short of the 10 million Apple was expected to be guiding to. The analyst also drew a parallel to 2017, with Apple unveiling the iPhone X at its September event but holding off shipment by several weeks on supply issues. If history repeats for the foldable, then volume will fall well short of 10 million and won’t add materially to FY2026 Q4 earnings.
What Does the Broadcom Deal Extension Through 2031 Mean for Apple?
Apple announced a deal with Broadcom to extend their agreement for development and supply of custom ASIC silicon through 2031. That adds six more years in which Apple secures the supply of custom silicon for connectivity and logic chips in iPhones. This lowers the supply risk on the iPhone 18, 19 and later models, while signaling that we don’t see Broadcom as getting replaced in the near term. Broadcom added 3.7% on the news; Apple added around 1%.
Bottom Line
Apple at $311.04 is within 2% of its 52-week high of $317.39 with a double top in RSI 70.73 that is getting close to overbought and distribution. The Broadcom deal extension to 2031 is good for supply and reduces procurement risk in custom silicon products for six additional years. The potential near-term sell catalyst is Kuo’s view the foldable iPhone ramp will come short at 7 to 8 million units with 500,000 to 1 million only in Q3, with an iPhone X parallel. Jefferies sees the stock as trading in a range, with consensus at approximately the current price. Below $300.30, then $289.90. Stop $317.30. The next binary event: Q3 earnings on July 30.
Disclaimer: The content of this article solely represents the author’s personal opinions and does not reflect the official stance of Tradingkey. It should not be considered as investment advice. The article is intended for reference purposes only, and readers should not base any investment decisions solely on its content. Tradingkey bears no responsibility for any trading outcomes resulting from reliance on this article. Furthermore, Tradingkey cannot guarantee the accuracy of the article’s content. Before making any investment decisions, it is advisable to consult an independent financial advisor to fully understand the associated risks.
Source: Original Article