






















Friday, July 10, 2026
No Result
View All Result
  • Home
  • Market Overview
    • All
    • Crude Oil Prices
    • Cryptocurrency News
    • Economy News
    • ETFs
    • Foreign Exchange News
    • Indices
    • Stock Market

    Global oil demand is dropping, but US drivers keep buying more gas

    Alphabet (GOOG) Price Forecast: Recovery Tests Key Bullish Breakout Zone

    How Investors Are Reacting To Molina Healthcare (MOH) Shifting Russell Style Indices After Illinois Medicaid Win

    Gold price slips as Trump says Iran ceasefire is over

    Crude Oil Prices Retreat as US-Iran Peace Talks Set to Continue

    Dangerous heat indices linger across the state today

    • Crude Oil Prices
    • Cryptocurrency News
    • Economy News
    • ETFs
    • Indices
    • Stock Market
    • Foreign Exchange News
    • Commodities News
  • Forex Market
    • All
    • Central Banks News
    • Currencies
    • Interest Rate
    • Nonfarm Payroll

    United States Dollar Index steady as traders weigh geopolitics, Fed outlook

    Euro trades flat despite soft European inflation

    Pound Sterling Price News and Forecast: GBP/USD holds firm as Trump ceasefire shock tests USD

    U.S. Dollar Pulls Back As Traders Focus On Potential De-Escalation In The Middle East: Analysis For EUR/USD, GBP/USD, USD/CAD, USD/JPY

    Fed Vows to Deliver Price Stability in Monetary Policy Report

    German Stocks Slip As Oil Tests Central Banks’ Nerves

    AUD/USD climbs as Chinese Yuan strength supports the Aussie

    Turkey Central Bank Sees July Inflation as Key for Rate Outlook

    Ukraine unveils new bill as war drives demand for cash

    • Central Banks News
    • Currencies
    • Interest Rate
    • Nonfarm Payroll
  • Commodities
    • All
    • Gold
    • Oil and Gas
    • Silver

    Occidental’s quarterly realized oil prices jump amid Iran war disruption

    IEA chief urges EU to revisit Arctic oil and gas drilling ban

    Oil Shock Revives Rate-Hike Fears as Gold Tests $4,000 Support

    ADNOC orders $900 million in new LNG carriers to expand global fleet

    Oil And Gas Refiners Stocks Investors Are Watching As Fuel Supply Tightens

    Magnolia Oil And Gas Eyes A Record Q2 Cash Flow

    • Gold
    • Oil and Gas
    • Silver
  • Crypto
    • All
    • Bitcoin
    • Ethereum
    • Litecoin
    • Ripple
    • Solana
    • XRP

    Ethereum Price Forecast: ETH Could Hit $2,400 If This Pattern Is Confirmed

    Bitcoin Rallies Toward $65,000 Level As Multiple Factors Drive Gains

    XRP price prediction July 2026: $1 floor vs CLARITY

    Standard Chartered doubles down on Bitcoin target despite MicroStrategy selloff

    Bitmine acquires $36M in Ethereum, boosting treasury holdings to 5.7 million ETH

    XRP Is Back: Rare Reversal Appears on Market

    • Bitcoin
    • Ethereum
    • Litecoin
    • Ripple
    • Solana
    • XRP
  • Charts
  • Economic Calendar
No Result
View All Result
Home Crypto

XRP Is Back: Rare Reversal Appears on Market

by MarketNewsBoard
3 hours ago
in Crypto, XRP
Share on FacebookShare on Twitter

One of $XRP‘s most notable recovery patterns in recent months might be on display. In contrast to many reversals that start with traditional technical formations like inverse head-and-shoulders patterns, double bottoms, or capitulation spikes, $XRP‘s most recent rebound seems to be emerging naturally through a slow change in market structure.

Bears are losing control

$XRP has been stuck in a steady downward trend on the daily chart for the majority of 2026. The asset was frequently driven lower by lower highs and lower lows, and the 50-day and 100-day moving averages served as dynamic resistance levels. However, it appears that sellers are starting to lose control based on recent price action.

The departure from the sharply declining trajectory that dominated June trading is the most noteworthy development. Without first creating a textbook reversal pattern, $XRP has begun printing higher lows. Instead of a dramatic flush followed by an explosive recovery, buyers have quietly stepped in near the $1.00 psychological support zone and consistently defended it.
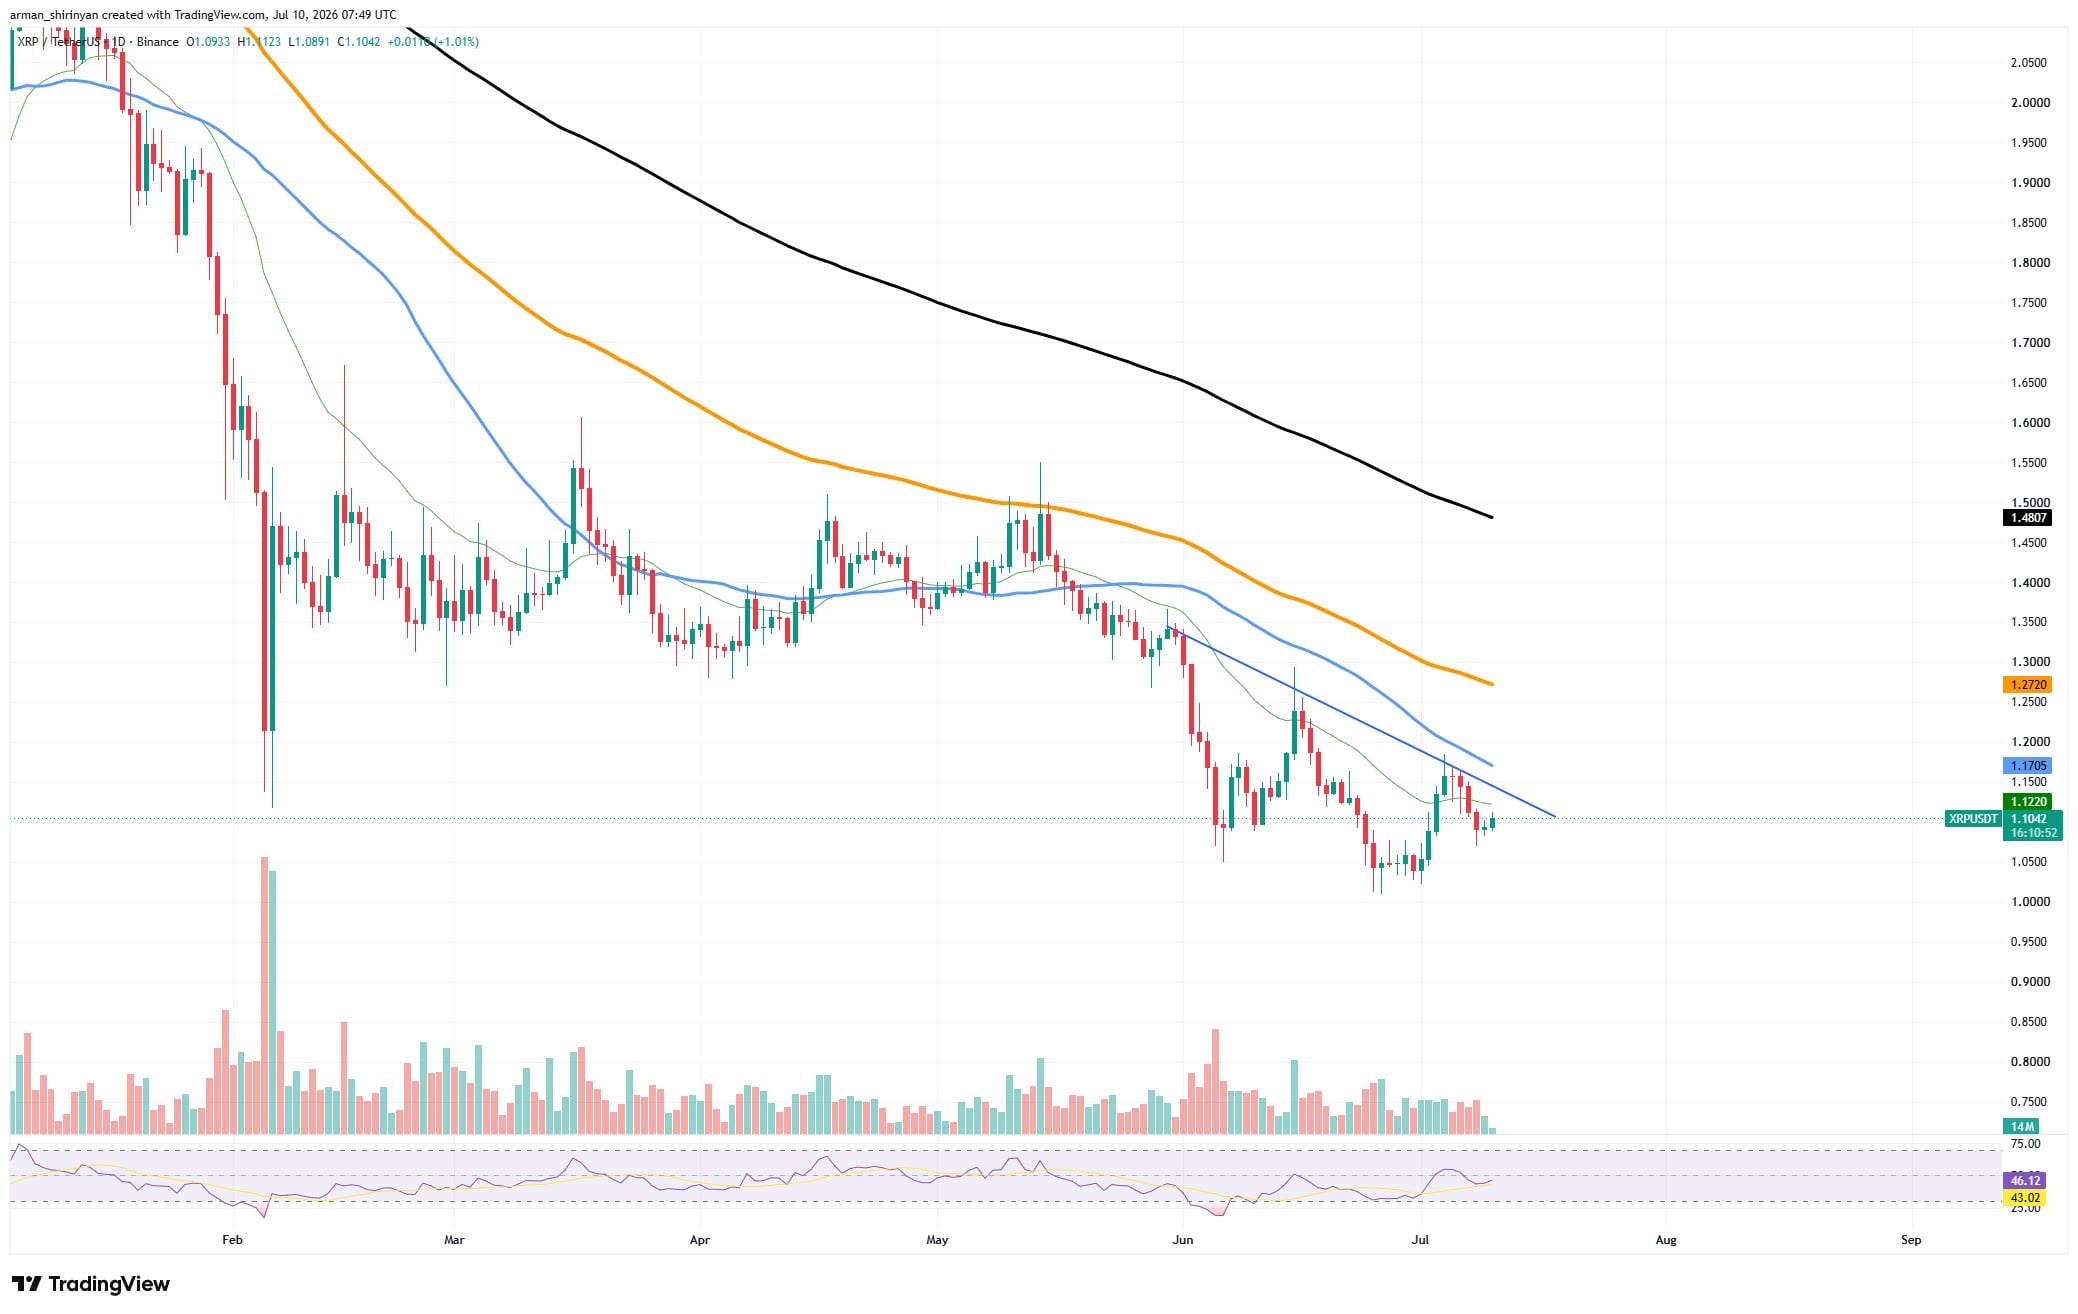
$XRP/USDT Chart by TradingView

This makes the current setup relatively rare. Markets frequently turn around after panic-driven selling events that produce clear bottoming structures. $XRP, by contrast, appears to be stabilizing through accumulation. Alongside the price structure’s slow improvement, the RSI has recovered and is starting to trend upward after moving out of oversold territory. The way $XRP interacts with the declining resistance trendline is another positive indication.

Long way to go

The price is currently trading directly below important moving averages that are grouped around the $1.15-$1.18 region after repeatedly challenging this barrier. Short-term momentum has returned to the bulls if there is a successful breakout above this area. While $XRP is trading below its longer-term moving averages, especially the 200-day EMA around $1.48, the overall trend is still negative.

But markets don’t instantly go from being bearish to being bullish. They usually go through a stabilization phase first, and $XRP seems to be going through just that. The next target might appear between $1.25 and $1.30, where the 100-day moving average is currently located, if buyers are successful in pushing $XRP above adjacent resistance levels.

If it doesn’t break higher, there will probably be another test of support around $1.00. For the time being, the fact that $XRP‘s recovery is not driven by a traditional bottom pattern makes it stand out. One higher low at a time, it is being built organically.

Source: Original Article

Previous Post

Oil Shock Revives Rate-Hike Fears as Gold Tests $4,000 Support

Next Post

Dangerous heat indices linger across the state today

RelatedPosts

Ethereum Price Forecast: ETH Could Hit $2,400 If This Pattern Is Confirmed

by MarketNewsBoard
39 minutes ago

Despite this, our analysis of trading volumes indicates that we are still far from the levels that the market usually trades when momentum, either positive...

Read moreDetails

Bitcoin Rallies Toward $65,000 Level As Multiple Factors Drive Gains

by MarketNewsBoard
1 hour ago

Bitcoin neared $65,000 on July 10 as numerous variables combined to fuel the latest upside. gettyBitcoin prices rallied on Friday, July 10, approaching $65,000 as...

Read moreDetails
Next Post

Dangerous heat indices linger across the state today

Crude Oil Prices Retreat as US-Iran Peace Talks Set to Continue

Recommended.

UBS has enough capital to satisfy planned Swiss reforms, central bank says

July 2, 2026

Autodesk’s SWOT analysis: stock expansion into operations market

July 7, 2026

Trending.

No Content Available
Market News Board | Market Analysis,Charts & News

MarketNewsBoard delivers trusted financial news, real-time market analysis, interactive charts, and economic insights across the global financial markets.

Covering Forex, Commodities, Stocks, Indices, Cryptocurrencies, and major economic events...

Follow Us

Market Overview

  • Forex Market
  • Commodities
  • Cryptocurrency News
  • Stocks
  • Indices
  • Crude Oil Prices
  • Economic Calendar

Resources

  • Central Banks News
  • Economy News
  • Interest Rate
  • Nonfarm Payroll
  • Charts

Tools

  • Currency Heat Map
  • Correlation Matrix
  • Market Sentiment
  • Currency Cross Rates
  • Crypto Rates
  • About Us
  • Contact Us
  • Disclaimer
  • Privacy Policy
  • Terms and Conditions

© 2026 MarketNewsBoard | Market Analysis, Charts & News.

AAPL
$315.32
AMZN
$245.34
BTC-USD
$63,998.84
EURUSD=X
$1.14
DX-Y.NYB
$100.97
NVDA
$210.96
TSLA
$407.76
DOW
$29.03
^N225
$68,557.73
JPY=X
$161.67
GBPUSD=X
$1.34
CAD=X
$1.42
NG=F
$2.95
BZ=F
$76.00
NFLX
$73.37
GOOG
$355.03
MSFT
$385.10
^RUT
$2,977.81
^FTSE
$10,497.29
AUDUSD=X
$0.696
CHF=X
$0.808
HG=F
$6.29
ETH=F
$1,796.00
No Result
View All Result
  • Home

© 2026 MarketNewsBoard | Market Analysis, Charts & News.
