


















Friday, July 10, 2026
No Result
View All Result
  • Home
  • Market Overview
    • All
    • Crude Oil Prices
    • Cryptocurrency News
    • Economy News
    • ETFs
    • Foreign Exchange News
    • Indices
    • Stock Market

    OKX, MetaMask, Matter Labs back dispute resolution court for AI agents

    Can Gold Escape the Bear Market? Forecast as of 10.07.2026

    Japan’s ‘invest locally’ plan likely to spur demand for assets like bitcoin (BTC), gold: Crypto Daily

    ETFs globally added Gold in H1 despite selling in May and June

    Oil Prices Rally on Renewed Hormuz Supply Risks

    What the rise in "real yields" says about markets

    • Crude Oil Prices
    • Cryptocurrency News
    • Economy News
    • ETFs
    • Indices
    • Stock Market
    • Foreign Exchange News
    • Commodities News
  • Forex Market
    • All
    • Central Banks News
    • Currencies
    • Interest Rate
    • Nonfarm Payroll

    Bank of England Warns of Escalating AI, Cyber & Market Risk

    Lower oil prices reduce the pressure on central banks

    British Pound retreats from multi-year highs as JPY strengthens

    Polish rate-setter Wnorowski says talk of Sept rate cut premature

    US Dollar Slides Amid Middle East Peace Hopes. Forecast as of 10.07.2026

    US Stock Market: Fed’s Williams sees energy prices easing despite Middle East tensions, keeps options open on July rate decision

    Syria Taps Safwat Raslan to Lead Central Bank

    GBP/USD Price Forecast: Edges higher above 1.3400, bullish outlook remains intact

    Canadian Dollar strengthens as receding Fed rate hike bets weigh US Dollar

    • Central Banks News
    • Currencies
    • Interest Rate
    • Nonfarm Payroll
  • Commodities
    • All
    • Gold
    • Oil and Gas
    • Silver

    Gold Price Today on July 10, 2026

    Crude oil rises, gas prices may follow | Local News

    Gold Price Forecast: XAU/USD wavers around $4,100 with the bearish trend intact

    Current price of oil as of July 10, 2026

    Generative AI in Oil & Gas Market to Surge: CAGR of

    Asian Stocks Climb and Oil Prices Slip as Traders Monitor Iran War Developments

    • Gold
    • Oil and Gas
    • Silver
  • Crypto
    • All
    • Bitcoin
    • Ethereum
    • Litecoin
    • Ripple
    • Solana
    • XRP

    XRP Price Rises 2% As AI Trades Drive Volume

    DeFi Development Doubles Down on Solana Strategy as Crypto Volatility Spurs Cost Cuts

    Michael Saylor’s recent Bitcoin sales are a worry for crypto investors

    JPMorgan: Private Blockchains Are Bitcoin’s Biggest Risk in 2026

    Ethereum price climbs toward $1,800 as short squeeze and risk-on rally gather pace

    XRP rebound faces weak demand, bearish setup

    • Bitcoin
    • Ethereum
    • Litecoin
    • Ripple
    • Solana
    • XRP
  • Charts
  • Economic Calendar
No Result
View All Result
Home Crypto

Ethereum price climbs toward $1,800 as short squeeze and risk-on rally gather pace

by MarketNewsBoard
2 hours ago
in Crypto, Ethereum
Share on FacebookShare on Twitter

Ethereum price has rebounded to nearly $1,800 after easing geopolitical tensions and an aggressive short squeeze across crypto derivatives restored appetite for risk assets, while traders now watch whether bulls can force a breakout above a key technical ceiling.

Summary

  • Ethereum price has climbed back toward $1,800 as easing geopolitical tensions triggered a sharp short squeeze.
  • Technical indicators favor bulls, with ETH reclaiming $1,750 and testing resistance near $1,800-$1,833.
  • Analysts see scope for a move toward $1,900, though failure to hold $1,750 could revive bearish pressure.

The second-largest cryptocurrency has recovered sharply from this week’s low near $1,505, when U.S. strikes on Iranian targets triggered a broad sell-off across digital assets. Sentiment reversed over the past 24 hours after fears of further escalation subsided, prompting investors to rotate back into higher-risk assets

A wave of forced short liquidations accelerated the move, pushing ETH through several resistance levels and back toward the psychologically important $1,800 mark.

Asian markets added another catalyst. South Korea’s Kospi index jumped roughly 4% as artificial intelligence and semiconductor stocks rallied, encouraging a wider return to growth assets.

Ethereum participated in that rotation despite U.S. spot Ether ETFs recording a combined net outflow of about $52 million on Thursday, suggesting overseas spot demand and crypto-native buying more than offset weaker institutional flows in the United States.

Fresh regulatory developments also improved sentiment. CFTC leadership has urged the U.S. Senate to advance the Digital Asset Market Clarity Act, a proposal that would establish a clearer regulatory framework for digital assets.

At the same time, Ethereum continues to dominate the tokenized real-world asset market with nearly half of global RWA value secured on its network, reinforcing the chain’s position as institutional tokenization activity expands.
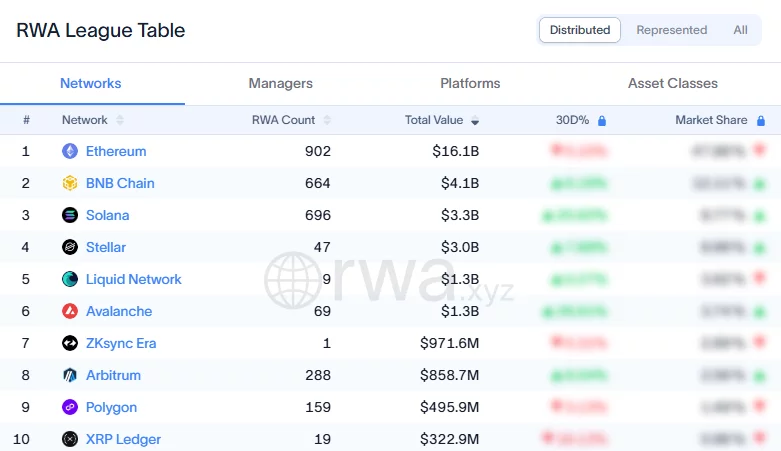
RWA League Table showing Ethereum leading tokenized real-world assets with $16.1B in value and nearly 48% market share.
Source: RWA.xyz

Ethereum has reclaimed key resistance, but $1,800 remains the decisive hurdle

The daily chart shows Ethereum reclaiming the 2/8 Murrey Math pivot near $1,750 after bouncing from the 0/8 support around $1,500. Price is now testing the upper edge of that range near $1,800, while the Chaikin Money Flow has climbed back into positive territory at 0.08, suggesting capital has started returning after weeks of sustained selling.
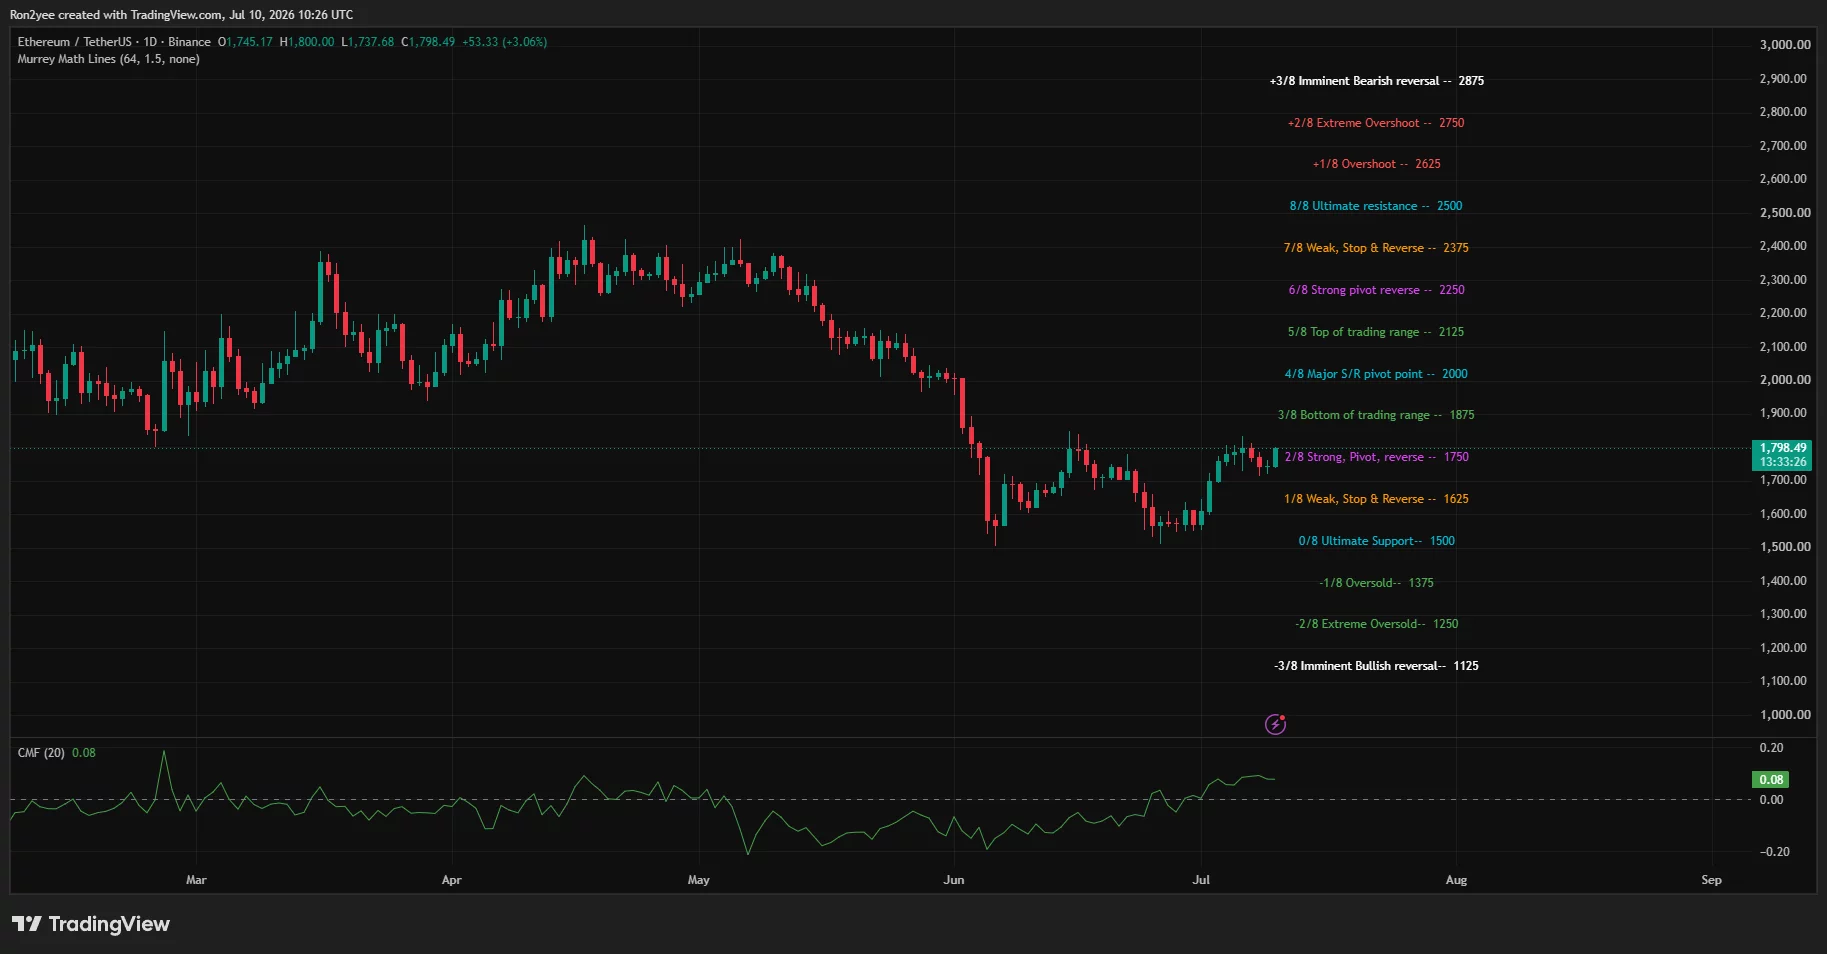
Ethereum daily chart showing ETH rebounding toward $1,800 after reclaiming the $1,750 pivot with positive CMF momentum.
Ethereum price daily chart — July 10 | Source: crypto.news

On the 4-hour chart, ETH has broken above the 78.6% Fibonacci retracement at approximately $1,773 and is trading just below resistance near $1,833. Momentum has strengthened as the MACD completes a fresh bullish crossover with expanding positive histogram bars, while the RSI has climbed above 62 without yet entering overbought territory. Together, those indicators leave room for another advance if buyers maintain control.
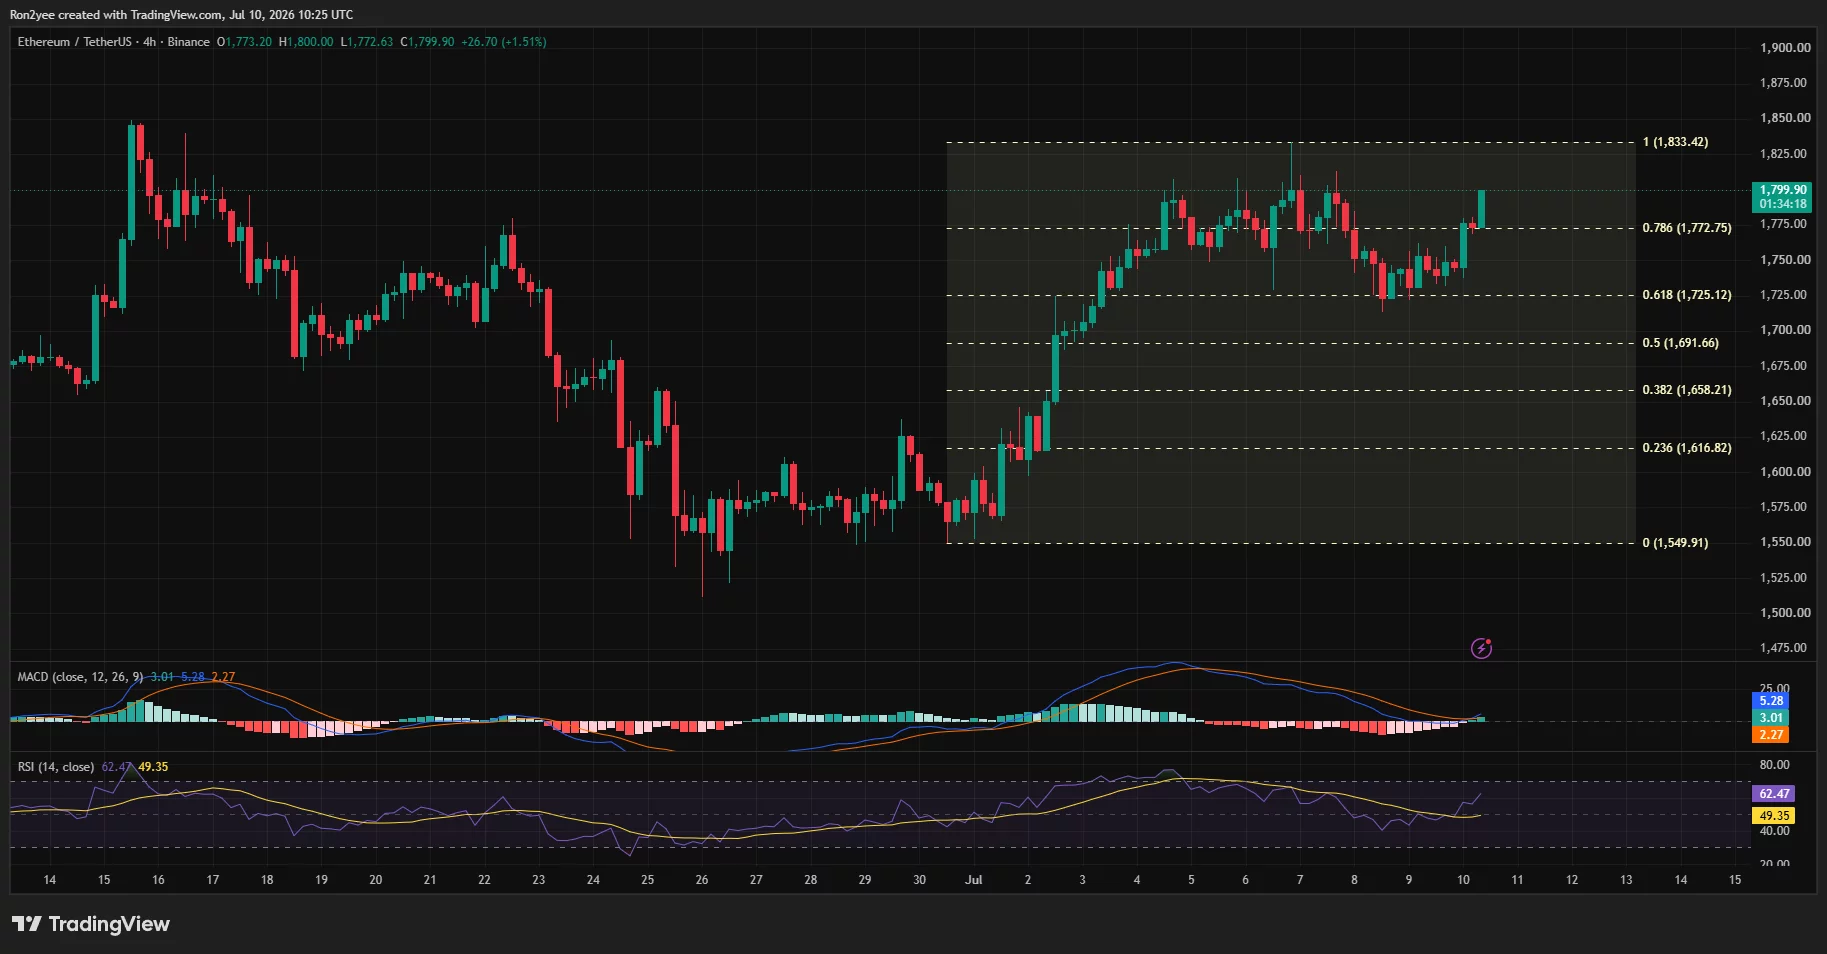
Ethereum 4-hour chart showing a breakout above the 0.786 Fibonacci level near $1,773 as RSI and MACD turn bullish.
Ethereum price 4-hour chart — July 10 | Source: crypto.news

Derivatives positioning supports the technical picture. CoinGlass liquidation data shows one of the largest short liquidation clusters sitting between $1,790 and $1,810. A sustained move above that zone could trigger another round of forced buying, while the next concentration of leveraged positions appears closer to $1,850. As long as those liquidity pockets remain overhead, volatility is likely to stay elevated.
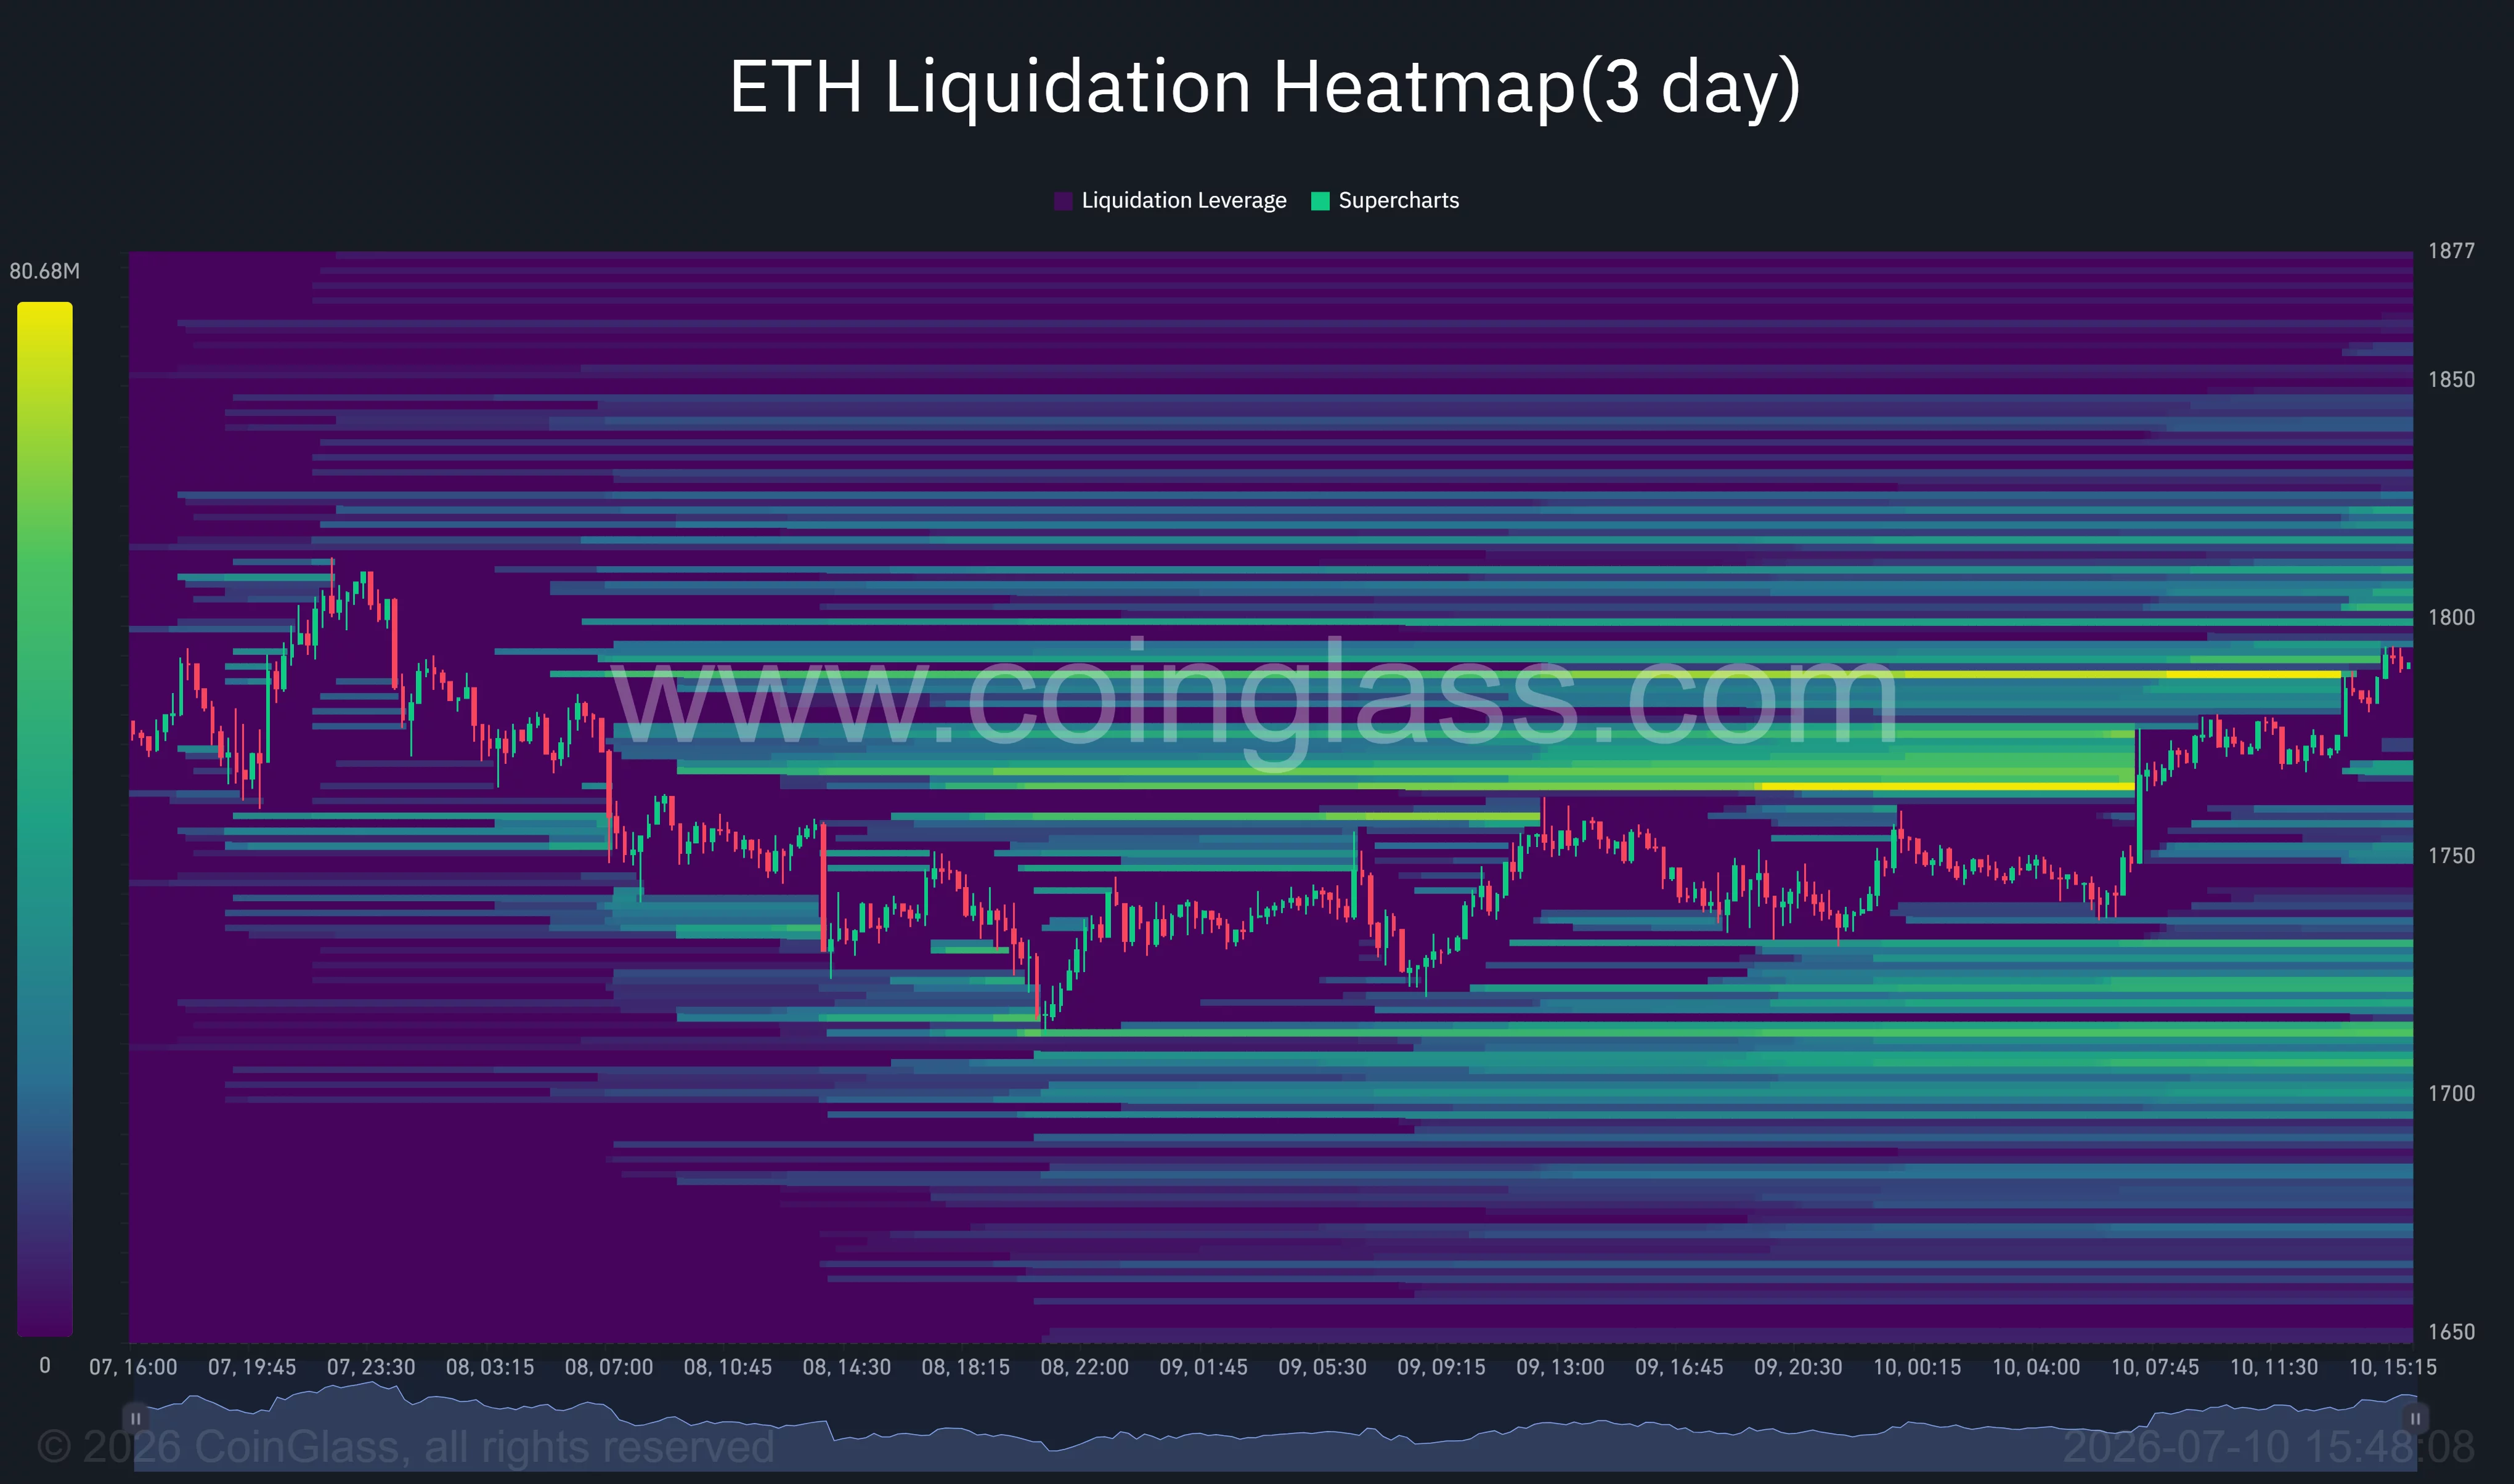
Ethereum liquidation heatmap highlighting dense short liquidation clusters around $1,790-$1,810 as ETH approaches $1,800.
Ethereum liquidation heatmap | Source: CoinGlass

Commenting on the latest structure, analyst Ted Pillows wrote:

“ETH is holding above the $1,750 level, which is a good sign. Spot demand is picking up a bit, which could push Ethereum towards the $1,850–$1,900 zone in the coming weeks.”

Separately, fellow analyst Alex Marzell argued that Ethereum has bounced from the lower boundary of a long-term descending channel and believes “one clean breakout above the upper trendline could change everything.”

$ETH is quietly setting up for something big.

Ethereum just delivered a strong bounce from the bottom of this massive descending channel.

The structure is still bearish for now, but one clean breakout above the upper trendline could change everything.

Breakout = trend… pic.twitter.com/Jp6Knn10CW

— Alex Marzell (@MarzellCrypto) July 10, 2026

Failure to hold $1,750 would weaken the recovery setup

Despite the improving momentum, Ethereum has not yet confirmed a trend reversal. The $1,800-$1,833 region combines Fibonacci resistance with a dense liquidity pocket, making it the first major test for bulls.

Repeated rejection from that area would increase the likelihood of another move toward $1,725, while a break below $1,750 would expose the $1,620-$1,550 support region that launched the current recovery.

Macro risks also remain. Any renewed escalation in the Middle East, stronger-than-expected U.S. inflation data, or another wave of ETF outflows could reduce demand for risk assets and interrupt Ethereum’s recovery. Until buyers establish support above $1,800, the current advance remains a recovery rally rather than a confirmed long-term trend reversal.

Disclosure: This article does not represent investment advice. The content and materials featured on this page are for educational purposes only.

Source: Original Article

Previous Post

XRP rebound faces weak demand, bearish setup

Next Post

Opening access for international investors to U.S. equities & ETFs

RelatedPosts

XRP Price Rises 2% As AI Trades Drive Volume

by MarketNewsBoard
1 hour ago

XRP Price Rises 2% as AI Trades Drive VolumeRipple (XRP) price increased 2% to $1.11 on Friday, closely tracking a broader market uptick but primarily...

Read moreDetails

DeFi Development Doubles Down on Solana Strategy as Crypto Volatility Spurs Cost Cuts

by MarketNewsBoard
2 hours ago

Key Points Interested in DeFi Development Corp.? Here are five stocks we like better. DeFi Development is tightening costs and shifting more legal and accounting...

Read moreDetails
Next Post

Opening access for international investors to U.S. equities & ETFs

Gold Price Forecast: XAU/USD wavers around $4,100 with the bearish trend intact

Recommended.

Crude Oil Prices Gulf War: Can Crude Oil Prices Drop to $50 Amid Changing Global Dynamics?, ETGovernment

July 5, 2026

Crypto Market Today, July 2: Bitcoin Breaks Away from Tech Stocks to Surge Above $61,000

July 2, 2026

Trending.

No Content Available
Market News Board | Market Analysis,Charts & News

MarketNewsBoard delivers trusted financial news, real-time market analysis, interactive charts, and economic insights across the global financial markets.

Covering Forex, Commodities, Stocks, Indices, Cryptocurrencies, and major economic events...

Follow Us

Market Overview

  • Forex Market
  • Commodities
  • Cryptocurrency News
  • Stocks
  • Indices
  • Crude Oil Prices
  • Economic Calendar

Resources

  • Central Banks News
  • Economy News
  • Interest Rate
  • Nonfarm Payroll
  • Charts

Tools

  • Currency Heat Map
  • Correlation Matrix
  • Market Sentiment
  • Currency Cross Rates
  • Crypto Rates
  • About Us
  • Contact Us
  • Disclaimer
  • Privacy Policy
  • Terms and Conditions

© 2026 MarketNewsBoard | Market Analysis, Charts & News.

AAPL
$316.22
AMZN
$247.04
BTC-USD
$64,240.73
EURUSD=X
$1.14
DX-Y.NYB
$100.88
NVDA
$202.78
TSLA
$406.55
DOW
$28.50
^N225
$68,557.73
JPY=X
$161.85
GBPUSD=X
$1.34
CAD=X
$1.42
NG=F
$2.96
BZ=F
$76.53
NFLX
$75.47
GOOG
$356.24
MSFT
$384.36
^RUT
$2,992.54
^FTSE
$10,494.97
AUDUSD=X
$0.695
CHF=X
$0.808
HG=F
$6.26
ETH=F
$1,798.50
No Result
View All Result
  • Home

© 2026 MarketNewsBoard | Market Analysis, Charts & News.