



















Friday, July 10, 2026
No Result
View All Result
  • Home
  • Market Overview
    • All
    • Crude Oil Prices
    • Cryptocurrency News
    • Economy News
    • ETFs
    • Foreign Exchange News
    • Indices
    • Stock Market

    Can Gold Escape the Bear Market? Forecast as of 10.07.2026

    Japan’s ‘invest locally’ plan likely to spur demand for assets like bitcoin (BTC), gold: Crypto Daily

    Opening access for international investors to U.S. equities & ETFs

    Bitcoin and Ethereum Have Rebounded to Intermediate Resistances

    Bitcoin (BTC) price challenges Monday’s rejection level as ether (ETH) looks to break its streak of lower highs

    Analysis-Trump makes the stock market his scoreboard, but many Americans aren’t even in the game

    • Crude Oil Prices
    • Cryptocurrency News
    • Economy News
    • ETFs
    • Indices
    • Stock Market
    • Foreign Exchange News
    • Commodities News
  • Forex Market
    • All
    • Central Banks News
    • Currencies
    • Interest Rate
    • Nonfarm Payroll

    Lower oil prices reduce the pressure on central banks

    British Pound retreats from multi-year highs as JPY strengthens

    Polish rate-setter Wnorowski says talk of Sept rate cut premature

    US Dollar Slides Amid Middle East Peace Hopes. Forecast as of 10.07.2026

    US Stock Market: Fed’s Williams sees energy prices easing despite Middle East tensions, keeps options open on July rate decision

    Syria Taps Safwat Raslan to Lead Central Bank

    GBP/USD Price Forecast: Edges higher above 1.3400, bullish outlook remains intact

    Canadian Dollar strengthens as receding Fed rate hike bets weigh US Dollar

    Australian Dollar edges higher to near 0.6950 on RBA hawkish rhetoric

    • Central Banks News
    • Currencies
    • Interest Rate
    • Nonfarm Payroll
  • Commodities
    • All
    • Gold
    • Oil and Gas
    • Silver

    Current price of oil as of July 10, 2026

    Asian Stocks Climb and Oil Prices Slip as Traders Monitor Iran War Developments

    Oil Stocks To Watch As Iran Sanctions Refocus Attention On U.S. Producers

    Gold Price Forecast: Central Bank Buying Counters Fed Pressure as Gold Tests $4,125 Resistance

    Gold discounts in India deepen as volatility hurts demand; purchases in China steady

    Gold price prediction: Will gold price see a bullish movement? Check July 10, 2026 outlook

    • Gold
    • Oil and Gas
    • Silver
  • Crypto
    • All
    • Bitcoin
    • Ethereum
    • Litecoin
    • Ripple
    • Solana
    • XRP

    DeFi Development Doubles Down on Solana Strategy as Crypto Volatility Spurs Cost Cuts

    JPMorgan: Private Blockchains Are Bitcoin’s Biggest Risk in 2026

    Ethereum price climbs toward $1,800 as short squeeze and risk-on rally gather pace

    XRP rebound faces weak demand, bearish setup

    Ethereum Foundation dissolves key protocol coordination team

    Robinhood Chain launches as a serious competitor to Solana in the race for DeFi dominance

    • Bitcoin
    • Ethereum
    • Litecoin
    • Ripple
    • Solana
    • XRP
  • Charts
  • Economic Calendar
No Result
View All Result
Home Market Overview

Costco Stock Price Forecast: High Valuation Meets Slowing Sales Growth, Can It Return to $1,000 in July?

by MarketNewsBoard
3 hours ago
in Market Overview, Stock Market
Share on FacebookShare on Twitter

TradingKey – As of July 10 ET, Costco ( COST) last stood at $912.97, down 4.21% on July 9 and up slightly by 0.22% in premarket trading. The stock price fell as the newly released June sales data showed a slowdown in growth.

The primary driver behind the decline in Costco’s share price is that its newly released June sales growth slowed compared to May.

According to the latest sales data, Costco’s net sales for the retail month of June were $29.24 billion, up 10.6% year-on-year; cumulative net sales for the first 44 weeks were $250.43 billion, up 10.1% year-on-year. Looking at absolute growth alone, June sales data remained strong. Compared with May, when net sales grew 14.5% year-on-year and total comparable sales rose 12.5%, June’s total comparable sales growth slowed to 8.8%. Excluding the impacts of gasoline prices and foreign exchange, total comparable sales in June grew 7.0%, which was also lower than May’s 8.0%. This indicates that while sales resilience remains, the growth rate has slowed down.

However, the market’s short-term focus is on the “gap in expectations.” Costco has long been regarded as a high-quality consumer leader, and its valuation has consistently remained higher than that of traditional retailers. Currently, the company’s P/E ratio is close to 46x, meaning that investors have already paid a high premium for its stable growth and defensive attributes. At this valuation level, the market has low tolerance for any slowdown in sales growth. As long as monthly sales growth retreats from high levels, even if absolute growth remains decent, it can easily trigger profit-taking.

In the medium to long term, Costco still possesses a strong moat. The company has a massive membership base, strong bargaining power in the supply chain, stable cash flow, and excellent inventory turnover efficiency. Membership fee income is an important source of its earnings quality, and its low-price strategy remains attractive during periods of economic uncertainty. However, whether the stock price can stabilize in the short term depends on whether the subsequent sales data for July and August can prove that the June slowdown was merely a temporary fluctuation, rather than the start of a weakening consumer trend.
cost-86d84126bae740ce8fa1fb293a2ec17f

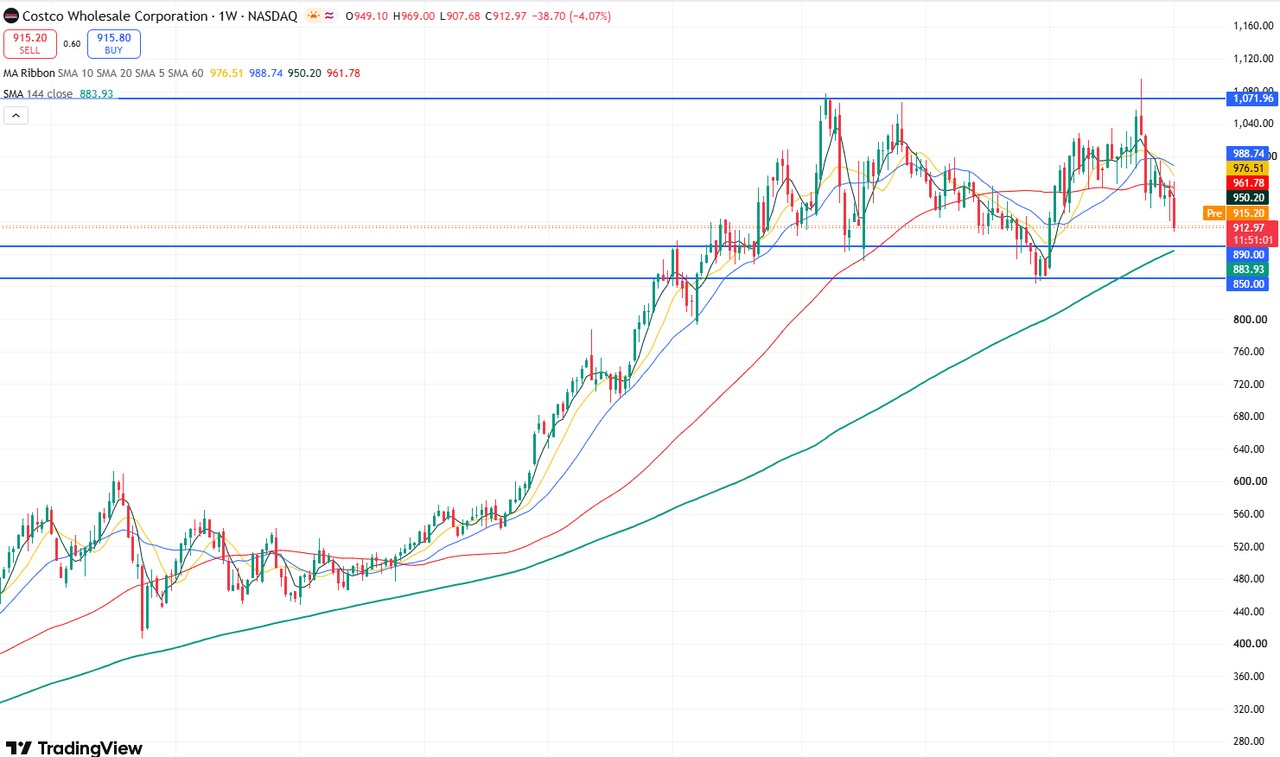
Costco stock price weekly chart, Source: TradingView

Looking at the weekly chart of Costco’s stock price, the stock is in a clear high-level range-bound phase, with a trading range of $1,070-$850. The stock has tested the resistance level near $1,070 upward for three consecutive times, all of which failed to break through. Although the stock hit an all-time high of $1,096.50 in May, the closing price for that week was still below $1,070, indicating heavy resistance at this level.

At present, after falling below the SMA60 twice consecutively, short-term market sentiment may have turned bearish, and the stock price may continue to pull back in the short term. The primary support to watch below is $890, which is also near the SMA144, potentially forming a confluence of support. If it continues to decline, it may test the support level at $850.

If the stock price holds above $890 and the SMA144, it may undergo a short-term technical rebound, with the primary target testing the resistance range of $950-$1,000. If the stock breaks through and stabilizes above $1,000, it could even test the $1,100 mark further up.

This content was translated using AI and reviewed for clarity. It is for informational purposes only.

Source: Original Article

Previous Post

Ripple Gets Full MiCA License in Europe: One of the Few to Clear the Bar

Next Post

Polish rate-setter Wnorowski says talk of Sept rate cut premature

RelatedPosts

Can Gold Escape the Bear Market? Forecast as of 10.07.2026

by MarketNewsBoard
4 minutes ago

2026.07.10 2026.07.10 Can Gold Escape the Bear Market? Forecast as of 10.07.2026Dmitri Demidenkohttps://www.litefinance.org/blog/authors/dmitri-demidenko/A 20% decline from recent highs is generally considered the beginning of a...

Read moreDetails

Japan’s ‘invest locally’ plan likely to spur demand for assets like bitcoin (BTC), gold: Crypto Daily

by MarketNewsBoard
24 minutes ago

This hidden form of taxation, first used by nations after World War II, allows authorities to finance deficits cheaply, gradually erode the real value of...

Read moreDetails
Next Post

Polish rate-setter Wnorowski says talk of Sept rate cut premature

Meme ETF rally leaves many underwater

Recommended.

Crude Oil Prices Gulf War: Can Crude Oil Prices Drop to $50 Amid Changing Global Dynamics?, ETGovernment

July 5, 2026

Editorial | Trump’s fickle behaviour over Iran puts world economy at risk

July 9, 2026

Trending.

No Content Available
Market News Board | Market Analysis,Charts & News

MarketNewsBoard delivers trusted financial news, real-time market analysis, interactive charts, and economic insights across the global financial markets.

Covering Forex, Commodities, Stocks, Indices, Cryptocurrencies, and major economic events...

Follow Us

Market Overview

  • Forex Market
  • Commodities
  • Cryptocurrency News
  • Stocks
  • Indices
  • Crude Oil Prices
  • Economic Calendar

Resources

  • Central Banks News
  • Economy News
  • Interest Rate
  • Nonfarm Payroll
  • Charts

Tools

  • Currency Heat Map
  • Correlation Matrix
  • Market Sentiment
  • Currency Cross Rates
  • Crypto Rates
  • About Us
  • Contact Us
  • Disclaimer
  • Privacy Policy
  • Terms and Conditions

© 2026 MarketNewsBoard | Market Analysis, Charts & News.

AAPL
$316.22
AMZN
$247.04
BTC-USD
$64,407.19
EURUSD=X
$1.14
DX-Y.NYB
$100.88
NVDA
$202.78
TSLA
$406.55
DOW
$28.50
^N225
$68,557.73
JPY=X
$161.85
GBPUSD=X
$1.34
CAD=X
$1.42
NG=F
$2.99
BZ=F
$76.90
NFLX
$75.47
GOOG
$356.24
MSFT
$384.36
^RUT
$2,992.54
^FTSE
$10,473.29
AUDUSD=X
$0.695
CHF=X
$0.807
HG=F
$6.25
ETH=F
$1,800.00
No Result
View All Result
  • Home

© 2026 MarketNewsBoard | Market Analysis, Charts & News.