






















Friday, July 10, 2026
No Result
View All Result
  • Home
  • Market Overview
    • All
    • Crude Oil Prices
    • Cryptocurrency News
    • Economy News
    • ETFs
    • Foreign Exchange News
    • Indices
    • Stock Market

    Technical Analysis of US Crude, XAUUSD, and EURUSD for Today (July 10, 2026)

    Polymarket takes next step in U.S. comeback with margin trading plan

    Virginia Gas Prices: Cheapest and most expensive places to fill up

    Stock Market Outlook: 3 Things Could Derail S&P 500 Rally, Morgan Stanley Says

    Indices trade higher; European mrkt advance | Capital Market News

    Global oil supply rose 4.1 million bpd in June as flows through Hormuz resumed, but remained 9.4 million bpd behind pre-war levels

    • Crude Oil Prices
    • Cryptocurrency News
    • Economy News
    • ETFs
    • Indices
    • Stock Market
    • Foreign Exchange News
    • Commodities News
  • Forex Market
    • All
    • Central Banks News
    • Currencies
    • Interest Rate
    • Nonfarm Payroll

    British Pound retreats from multi-year highs as JPY strengthens

    US Dollar Slides Amid Middle East Peace Hopes. Forecast as of 10.07.2026

    US Stock Market: Fed’s Williams sees energy prices easing despite Middle East tensions, keeps options open on July rate decision

    Syria Taps Safwat Raslan to Lead Central Bank

    GBP/USD Price Forecast: Edges higher above 1.3400, bullish outlook remains intact

    Canadian Dollar strengthens as receding Fed rate hike bets weigh US Dollar

    Australian Dollar edges higher to near 0.6950 on RBA hawkish rhetoric

    Loonie Tunes: Playing Second Fiddle to the Greenback

    British Pound gains traction above 1.3400 as markets bet on BoE rate hikes

    • Central Banks News
    • Currencies
    • Interest Rate
    • Nonfarm Payroll
  • Commodities
    • All
    • Gold
    • Oil and Gas
    • Silver

    Oil Stocks To Watch As Iran Sanctions Refocus Attention On U.S. Producers

    Gold Price Forecast: Central Bank Buying Counters Fed Pressure as Gold Tests $4,125 Resistance

    Gold slips on inflation fears tied to US-Iran conflict – Shafaq News

    Gold, silver prices today, 10 July: Check retail rates of 24K, 22K gold, 999 silver in Delhi, Mumbai and Kolkata

    Gold prices rise – VnExpress International

    Gold prices muted, head for weekly losses on Iran, rate jitters

    • Gold
    • Oil and Gas
    • Silver
  • Crypto
    • All
    • Bitcoin
    • Ethereum
    • Litecoin
    • Ripple
    • Solana
    • XRP

    Robinhood Could Be a Major Threat to Solana. Here’s Why.

    XRP price holds above $1.10: can bulls break the $1.17 resistance w all?

    Ripple Gets Full MiCA License in Europe: One of the Few to Clear the Bar

    Live updates: Bitcoin ETFs bleed again while ether funds snap a five-day inflow streak

    BTC, XRP, ETH price news: Strong in USD, lagging in yen

    Ethereum Foundation says AI agents are finding real protocol bugs, human verification remains critical

    • Bitcoin
    • Ethereum
    • Litecoin
    • Ripple
    • Solana
    • XRP
  • Charts
  • Economic Calendar
No Result
View All Result
Home Commodities

Gold Price Forecast: Central Bank Buying Counters Fed Pressure as Gold Tests $4,125 Resistance

by MarketNewsBoard
4 hours ago
in Commodities, Gold
Share on FacebookShare on Twitter

Gold prices remain under pressure as easing geopolitical tensions and a cautious Federal Reserve continue to weigh on investor sentiment. Spot gold traded near $4,053 on July 10, extending its consolidation after failing to reclaim a key technical resistance level.

While the reduction in Middle East tensions has softened immediate safe-haven demand, the metal continues to draw support from central bank purchases, persistent inflation, and elevated global debt levels.

As the market balances these opposing forces, traders are watching whether buyers can reclaim $4,091 or if bearish momentum will push prices toward lower support levels.

Central Bank Demand Keeps Gold’s Long-Term Outlook Intact

Gold’s recent weakness largely reflects improving geopolitical conditions following the implementation of the Islamabad Memorandum of Understanding, the interim agreement between the United States and Iran.

The reopening of the Strait of Hormuz and the resumption of Iranian crude exports have eased concerns over global energy supplies, removing part of the geopolitical risk premium that previously supported precious metals.

Lower energy prices have also helped reduce inflation expectations, limiting demand for traditional safe-haven assets. However, geopolitical uncertainty has not disappeared entirely, and any deterioration in diplomatic relations could quickly revive demand for gold as a defensive asset.

Monetary policy remains another major influence on the market. The Federal Reserve has maintained a higher-for-longer interest rate stance as inflation remains above its target, supporting both Treasury yields and the U.S. dollar. Since gold does not generate income, higher real yields increase its opportunity cost and have limited upside momentum in recent weeks.

Despite these near-term headwinds, gold’s structural fundamentals remain supportive. Central banks continue to diversify reserve holdings, with sustained buying from emerging-market institutions providing a steady source of demand. These purchases have helped establish a long-term price floor that is less sensitive to short-term fluctuations in interest rates or investor sentiment.

Inflation also remains an important pillar for the precious metal. Although price pressures have eased from previous highs, inflation continues to exceed the Federal Reserve’s target, while elevated global debt and uncertainty surrounding future monetary policy reinforce gold’s role as a portfolio diversifier.

Supply conditions further strengthen the long-term outlook. Mine production remains relatively constrained due to lengthy project development timelines, declining ore grades, and higher operating costs, limiting the industry’s ability to respond quickly to higher prices.

Descending Trendline Keeps Gold Below Key Resistance

From a technical perspective, gold continues to trade below a long-term descending trendline on the four-hour chart, leaving sellers in control of the short-term trend. The market remains characterized by lower highs and lower lows following the breakdown from trendline support.

The first major resistance is located at $4,091, where the descending trendline converges with previous support that has now turned into resistance. A sustained move above this level would improve the technical outlook and expose the next upside targets at $4,157 and $4,222.

On the downside, immediate support is located at $4,024. A break below this level would strengthen bearish momentum and bring $3,962 into focus, followed by the broader support area near $3,903.

The 200-period Exponential Moving Average (EMA) near $4,257 continues to reinforce the broader bearish trend after repeatedly rejecting recovery attempts.

Momentum indicators suggest selling pressure remains dominant, although downside momentum has started to stabilize. The Relative Strength Index (RSI) is hovering near 38.5, indicating weak momentum while remaining above oversold territory. Meanwhile, the MACD histogram remains in negative territory but has begun to flatten, suggesting bearish momentum is gradually easing.

Gold Price Outlook

Gold continues to face short-term pressure from higher interest rates, a stronger U.S. dollar, and easing geopolitical tensions. However, sustained central bank buying, resilient investment demand, constrained mine supply, and persistent inflation continue to support its long-term investment case.
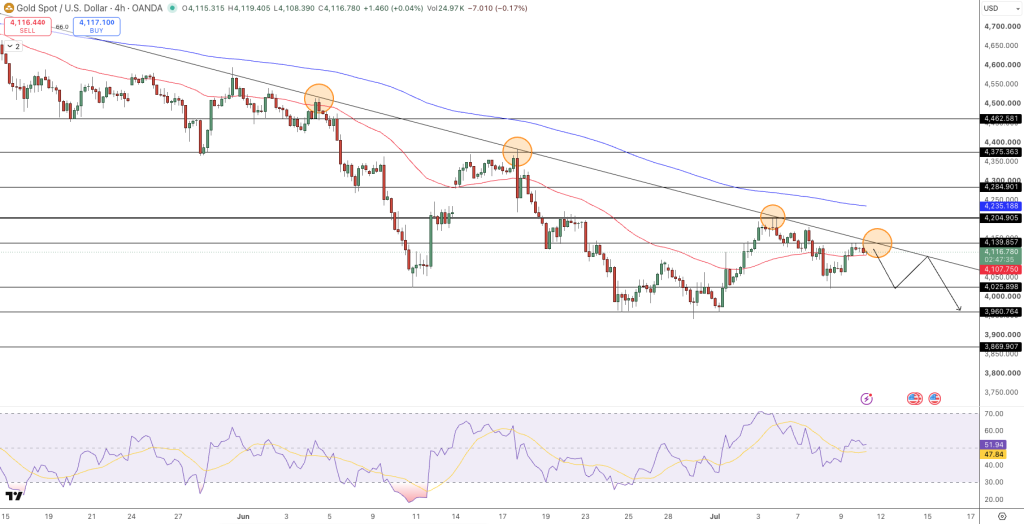
For now, $4,091 remains the key level for bulls to reclaim. A confirmed breakout above this resistance could pave the way for a recovery toward $4,157 and $4,222, while a break below $4,024 would reinforce the bearish outlook and expose $3,962 as the next downside target. Until a decisive move develops, traders are likely to focus on incoming inflation data, Federal Reserve commentary, and geopolitical developments for the next catalyst.

Source: Original Article

Previous Post

Live updates: Bitcoin ETFs bleed again while ether funds snap a five-day inflow streak

Next Post

IMF official says global economy remains resilient despite Middle East war – VIDEO

RelatedPosts

Oil Stocks To Watch As Iran Sanctions Refocus Attention On U.S. Producers

by MarketNewsBoard
3 hours ago

Geopolitical shocks in the Middle East, renewed sanctions on Iranian oil and surprisingly muted moves in crude prices are putting fresh attention on large oil...

Read moreDetails

Gold slips on inflation fears tied to US-Iran conflict – Shafaq News

by MarketNewsBoard
5 hours ago

2026-07-10T05:16:01+00:00 font Enable Reading Mode A- A A+ Shafaq NewsGold edged ​lower on Friday and was on track for a weekly fall on ‌concerns that...

Read moreDetails
Next Post

IMF official says global economy remains resilient despite Middle East war - VIDEO

Oil Stocks To Watch As Iran Sanctions Refocus Attention On U.S. Producers

Recommended.

Canadian Dollar declines on falling oil prices

July 3, 2026

One Leveraged ETF Is Reshaping Trading in World's Top AI Memory Stock

July 1, 2026

Trending.

No Content Available
Market News Board | Market Analysis,Charts & News

MarketNewsBoard delivers trusted financial news, real-time market analysis, interactive charts, and economic insights across the global financial markets.

Covering Forex, Commodities, Stocks, Indices, Cryptocurrencies, and major economic events...

Follow Us

Market Overview

  • Forex Market
  • Commodities
  • Cryptocurrency News
  • Stocks
  • Indices
  • Crude Oil Prices
  • Economic Calendar

Resources

  • Central Banks News
  • Economy News
  • Interest Rate
  • Nonfarm Payroll
  • Charts

Tools

  • Currency Heat Map
  • Correlation Matrix
  • Market Sentiment
  • Currency Cross Rates
  • Crypto Rates
  • About Us
  • Contact Us
  • Disclaimer
  • Privacy Policy
  • Terms and Conditions

© 2026 MarketNewsBoard | Market Analysis, Charts & News.

AAPL
$316.22
AMZN
$247.04
BTC-USD
$64,368.13
EURUSD=X
$1.14
DX-Y.NYB
$100.86
NVDA
$202.78
TSLA
$406.55
DOW
$28.50
^N225
$68,557.73
JPY=X
$161.80
GBPUSD=X
$1.34
CAD=X
$1.42
NG=F
$2.98
BZ=F
$76.12
NFLX
$75.47
GOOG
$356.24
MSFT
$384.36
^RUT
$2,992.54
^FTSE
$10,475.86
AUDUSD=X
$0.695
CHF=X
$0.807
HG=F
$6.26
ETH=F
$1,799.00
No Result
View All Result
  • Home

© 2026 MarketNewsBoard | Market Analysis, Charts & News.