













Wednesday, July 8, 2026
No Result
View All Result
  • Home
  • Market Overview
    • All
    • Crude Oil Prices
    • Cryptocurrency News
    • Economy News
    • ETFs
    • Foreign Exchange News
    • Indices
    • Stock Market

    Conagra Brands (CAG) Joins Russell Indices, Is It Still 4% Undervalued?

    Iran tensions add fresh uncertainty to the global economy : NPR

    Citi Names Top Life Science Tools & Diagnostics Stocks for Second Half

    (FCUD.U) Market Performance Analysis

    Clatsop County news briefs for July 9, 2026

    After a four-year U.S. ban, Polymarket mounts a major comeback campaign

    • Crude Oil Prices
    • Cryptocurrency News
    • Economy News
    • ETFs
    • Indices
    • Stock Market
    • Foreign Exchange News
    • Commodities News
  • Forex Market
    • All
    • Central Banks News
    • Currencies
    • Interest Rate
    • Nonfarm Payroll

    Fed’s Balancing Act: Inflation Concerns and Rate Decision

    U.S. Dollar Gains Ground Amid Rally In The Oil Markets: Analysis For EUR/USD, GBP/USD, USD/CAD, USD/JPY

    Canadian Dollar strengthens on Oil rally as Fed, jobs data loom

    The IMF hopes to engage on central banks’ changes to forward guidance

    IMF says hopes to engage on central banks’ changes to forward guidance

    Australian Dollar remains pressured amid Trump comments

    What we can learn from central bank investment plans

    Romania’s central bank holds interest rate at 6.5%

    British Pound slumps against US Dollar as risky assets turn fragile

    • Central Banks News
    • Currencies
    • Interest Rate
    • Nonfarm Payroll
  • Commodities
    • All
    • Gold
    • Oil and Gas
    • Silver

    Oil prices jump over 7% as Iran ceasefire declared ‘Over’

    Magnolia Oil & Gas (MGY) Rises With Oil Prices, Is It Still Trading At A Discount?

    Adilet Party hosts talks on oil & gas industry development

    EZCORP Stock to Watch as Pawn Demand and Gold Prices Lift Profit

    Gold and Silver Sink as Death of US-Iran MOU Sends Oil, Rates Jumping

    Oil prices jump as Trump declares Iran ceasefire ‘over.’ What about gas?

    • Gold
    • Oil and Gas
    • Silver
  • Crypto
    • All
    • Bitcoin
    • Ethereum
    • Litecoin
    • Ripple
    • Solana
    • XRP

    Best Solana meme coins to watch as July rally builds

    ETHA vs. IBIT: Does Ethereum or Bitcoin Belong in Your Portfolio?

    Barclays Analyst Says Buy MSTR Stock Even as Strategy Sells Bitcoin

    ETH at $1,730: Down 65% With Its Biggest Upgrade Weeks Away

    Ripple Price Analysis: The Critical Level XRP Must Defend to Avoid Another Breakdown

    Cardano Founder Criticizes Ethereum’s Innovation Plan

    • Bitcoin
    • Ethereum
    • Litecoin
    • Ripple
    • Solana
    • XRP
  • Charts
  • Economic Calendar
No Result
View All Result
Home Crypto

Ripple Price Analysis: The Critical Level XRP Must Defend to Avoid Another Breakdown

by MarketNewsBoard
4 hours ago
in Crypto, XRP
Share on FacebookShare on Twitter

XRP remains under pressure across both the USDT and BTC pairs, with sellers continuing to control the broader trend despite several short-lived recovery attempts. While the USDT chart shows buyers defending an important support area, the XRP/BTC pair continues to trade near multi-month lows, highlighting the token’s persistent relative weakness against the market leader.

Ripple Price Analysis: The USDT Pair

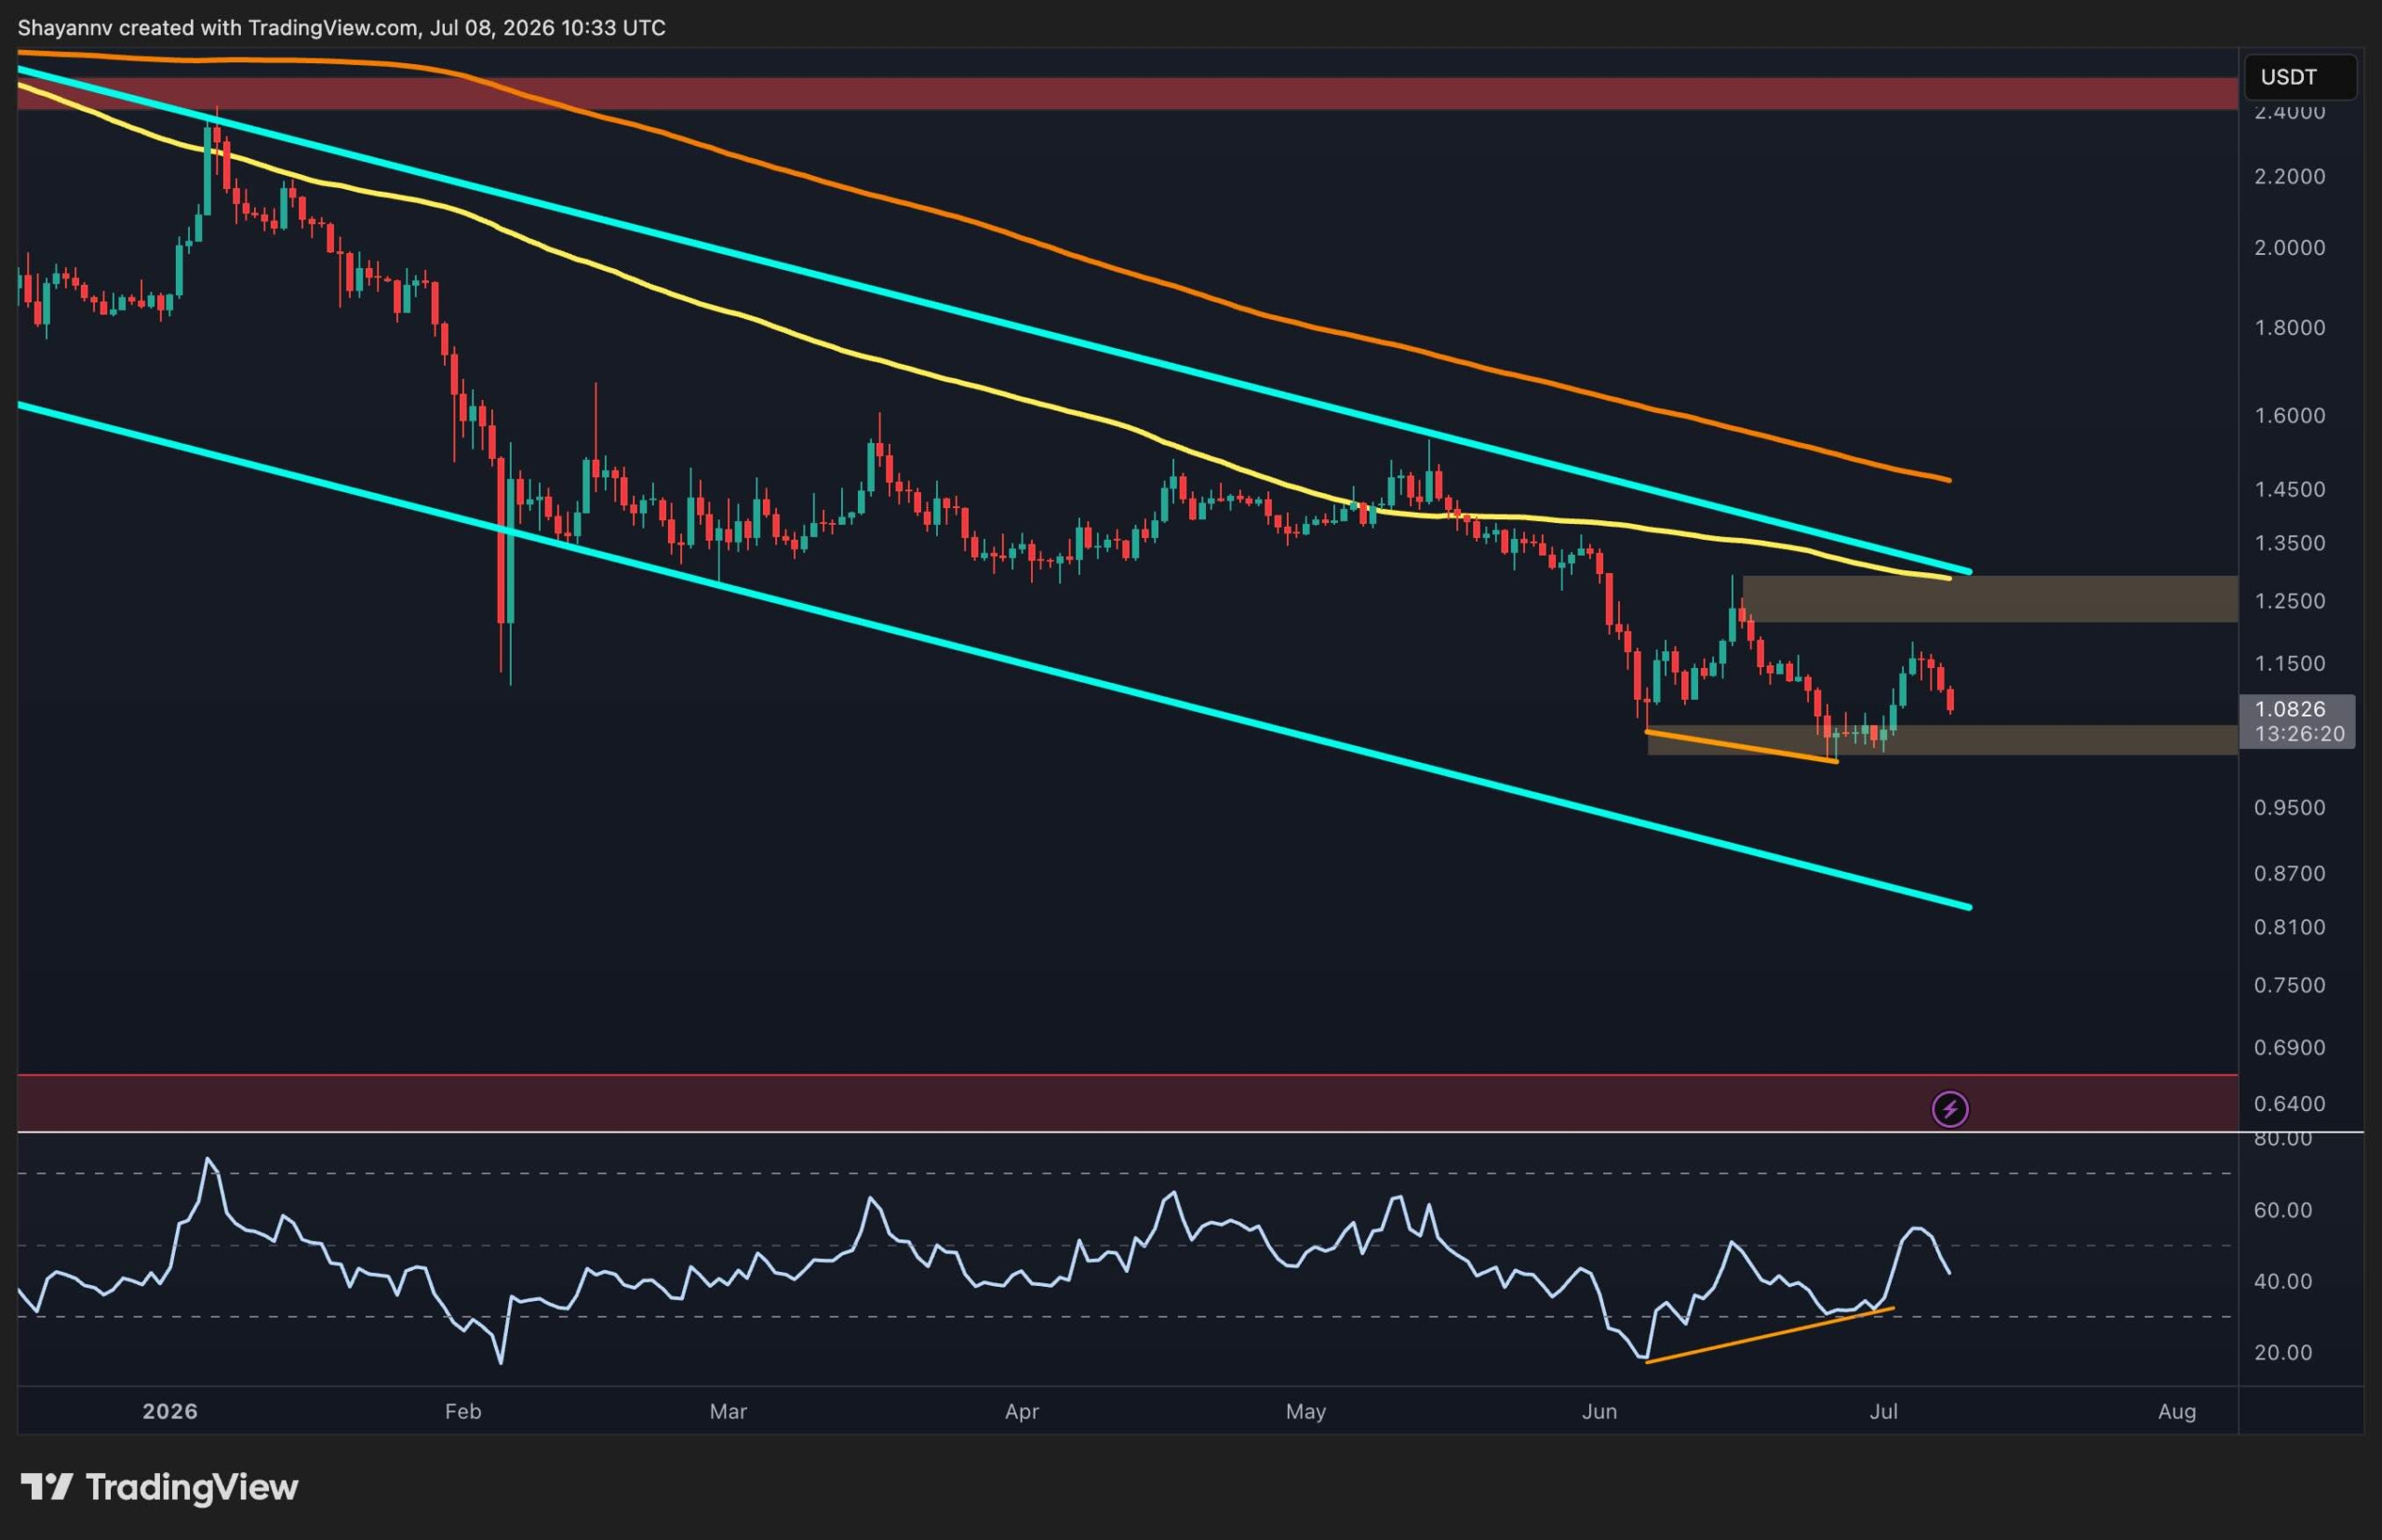
On the daily timeframe, XRP continues to trade inside a well-defined descending channel, keeping the broader market structure firmly bearish. It remains below the 100-day and 200-day moving averages, both of which are sloping lower and acting as dynamic resistance above $1.25. This alignment suggests that momentum still favors sellers unless a meaningful trend reversal develops.

After losing the $1.25 level in early June, XRP found demand around the critical $1 region, where buyers have repeatedly stepped in to prevent further downside. This zone has now become the most important support to monitor. As long as it holds, the market could continue forming a short-term base.

On the upside, the first major resistance sits around $1.25. As mentioned earlier, this area also coincides with the descending 100-day moving average and the higher boundary of the channel, making it a significant hurdle for any sustained recovery. A successful breakout above this region would expose the 200-day moving average around $1.45, while losing the $1 support could accelerate another leg lower toward the channel’s lower trendline around $0.80.

Meanwhile, the RSI has been making higher lows despite the price making lower lows near $1, creating a developing bullish divergence. Although this does not confirm a reversal on its own, it suggests that bearish momentum might be exhausted and that buyers could attempt another recovery if resistance levels begin to weaken.
The BTC Pair

Against Bitcoin, XRP continues to paint a weaker technical picture. Again, the pair remains below both major moving averages, which continue to trend lower and reinforce the long-term bearish structure.

After several weeks of sideways trading, XRPBTC is once again testing the key horizontal support around 1,700 sats. This level has acted as the floor for the recent consolidation, and another breakdown attempt is now underway. A confirmed daily close below 1,700 sats would likely invalidate the current range and increase the probability of an extension toward the next major demand zone around 1,450 to 1,500 sats.

To regain bullish momentum, buyers first need to reclaim the 1,850 sats resistance area, which also aligns closely with the declining 100-day moving average. Until then, every rally continues to appear corrective within the broader downtrend, which could lead to more depreciation for XRP against Bitcoin.


SPECIAL OFFER (Exclusive)

LIMITED OFFER for CryptoPotato readers at Bybit: Use this link to register and open a $500 FREE position on any coin!

Disclaimer: Information found on CryptoPotato is those of writers quoted. It does not represent the opinions of CryptoPotato on whether to buy, sell, or hold any investments. You are advised to conduct your own research before making any investment decisions. Use provided information at your own risk. See Disclaimer for more information.

Source: Original Article

Previous Post

Brompton Global Equity HighPay ETF Declares July Distributions

Next Post

EZCORP Stock to Watch as Pawn Demand and Gold Prices Lift Profit

RelatedPosts

Best Solana meme coins to watch as July rally builds

by MarketNewsBoard
2 hours ago

Speculative fever has returned to the Solana network with a vengeance, driving daily token creation to an 80-day high as July kicks into gear. Bolstered...

Read moreDetails

ETHA vs. IBIT: Does Ethereum or Bitcoin Belong in Your Portfolio?

by MarketNewsBoard
3 hours ago

ETFs containing Bitcoin and Ethereum have mirrored their underlying cryptocurrencies. Source: Original Article

Read moreDetails
Next Post

EZCORP Stock to Watch as Pawn Demand and Gold Prices Lift Profit

Oil Prices Jump After Trump Says Ceasefire With Iran Is Over -- Commodities Roundup

Recommended.

10 things to know before you invest in gold

July 7, 2026

Non-Farm Payrolls report on July 2 may sway Fed rate decision in 2026

June 30, 2026

Trending.

No Content Available
Market News Board | Market Analysis,Charts & News

MarketNewsBoard delivers trusted financial news, real-time market analysis, interactive charts, and economic insights across the global financial markets.

Covering Forex, Commodities, Stocks, Indices, Cryptocurrencies, and major economic events...

Follow Us

Market Overview

  • Forex Market
  • Commodities
  • Cryptocurrency News
  • Stocks
  • Indices
  • Crude Oil Prices
  • Economic Calendar

Resources

  • Central Banks News
  • Economy News
  • Interest Rate
  • Nonfarm Payroll
  • Charts

Tools

  • Currency Heat Map
  • Correlation Matrix
  • Market Sentiment
  • Currency Cross Rates
  • Crypto Rates
  • About Us
  • Contact Us
  • Disclaimer
  • Privacy Policy
  • Terms and Conditions

© 2026 MarketNewsBoard | Market Analysis, Charts & News.

AAPL
$314.56
AMZN
$241.75
BTC-USD
$62,204.12
EURUSD=X
$1.14
DX-Y.NYB
$100.98
NVDA
$202.65
TSLA
$392.21
DOW
$29.49
^N225
$66,819.05
JPY=X
$162.47
GBPUSD=X
$1.34
CAD=X
$1.42
NG=F
$3.20
BZ=F
$78.08
NFLX
$76.08
GOOG
$355.28
MSFT
$383.81
^RUT
$2,953.51
^FTSE
$10,489.04
AUDUSD=X
$0.694
CHF=X
$0.808
HG=F
$6.13
ETH=F
$1,743.00
No Result
View All Result
  • Home

© 2026 MarketNewsBoard | Market Analysis, Charts & News.