























Cryptocurrencies are broadly extending declines on Wednesday, after last week’s recovery. The sell-off has seen Bitcoin (BTC) slide below $62,000, increasing downside risks toward the next key support at $60,000.
Ethereum (ETH) is edging lower, targeting the demand range at $1,700, while Ripple (XRP) remains under pressure, trading around $1.08.
Crypto sell-off intensifies as sellers assess Middle East conflict
Headwinds continue to weigh on the crypto market, as geopolitical tensions in the Middle East escalate. According to AP News, Iran launched attacks on American military bases in the Middle East on Wednesday in retaliation for attacks by the United States (US) on several places in Iran. The US has also reinstated sanctions on Iran’s Oil sales, saying that the developments were in response to Iranian attacks on ships in the Strait of Hormuz.
The fresh attacks have ignited fears that the war between the US and Iran could resume. US President Donald Trump fueled the fears, stating that the Memorandum of Understanding (MoU) that paused fighting is “over.” However, Trump added that negotiations will be allowed to continue.
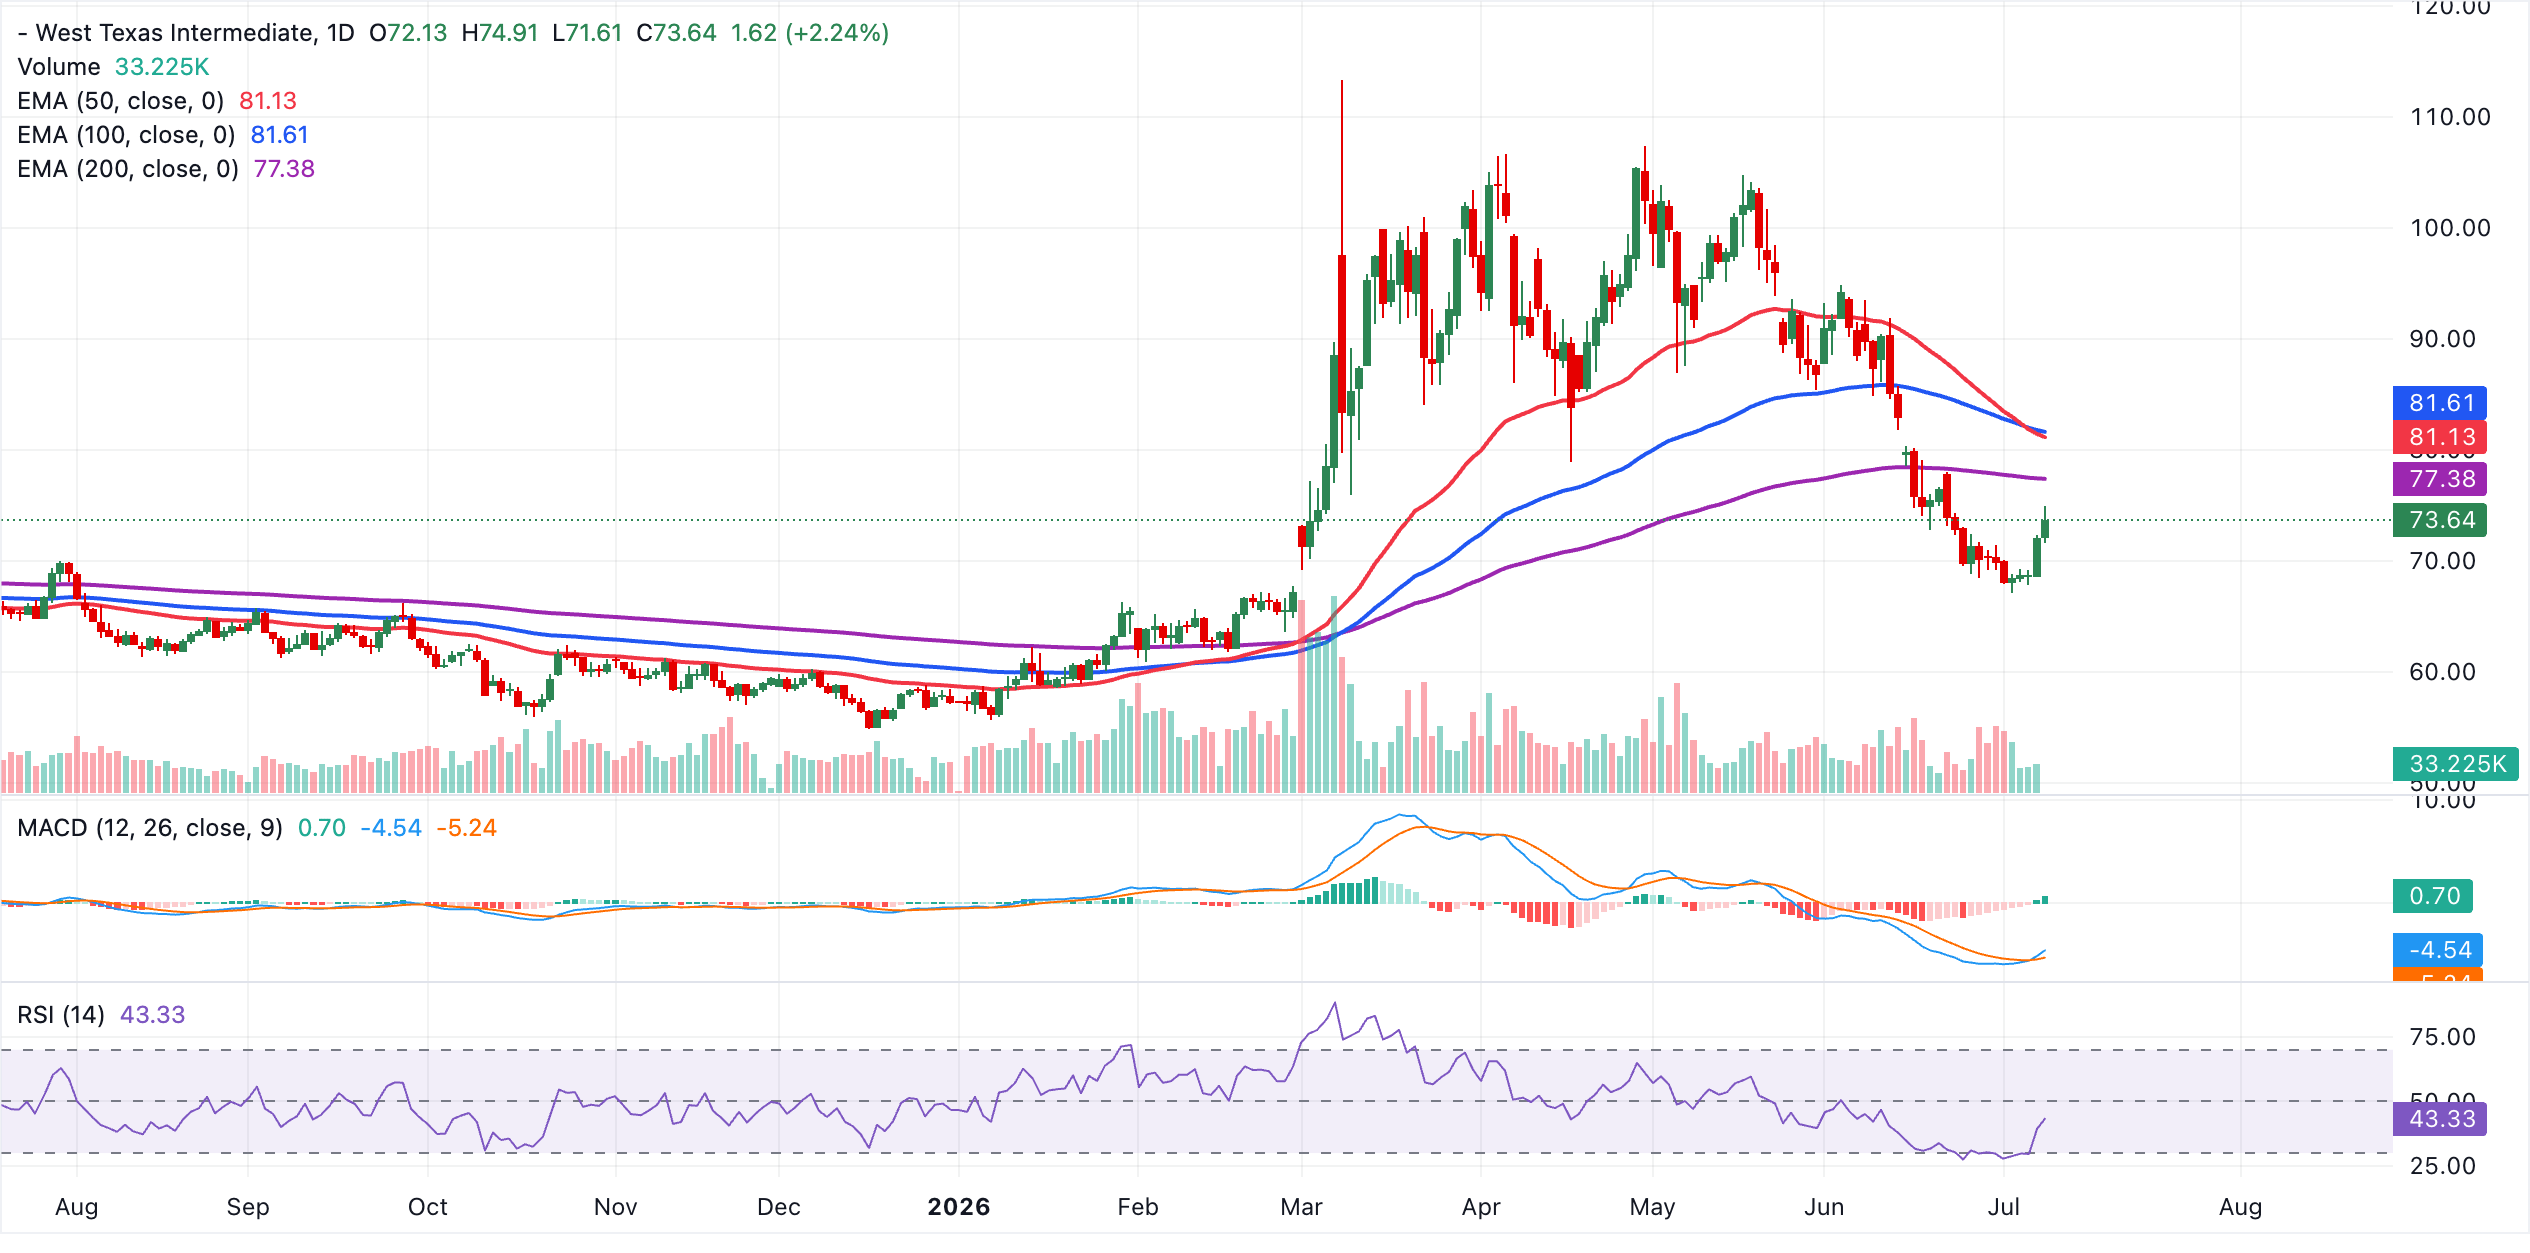
Oil prices jumped amid the attacks and geopolitical uncertainty. West Texas Intermediate (WTI) Crude traded at $74 on Wednesday, up from $67 the previous day.
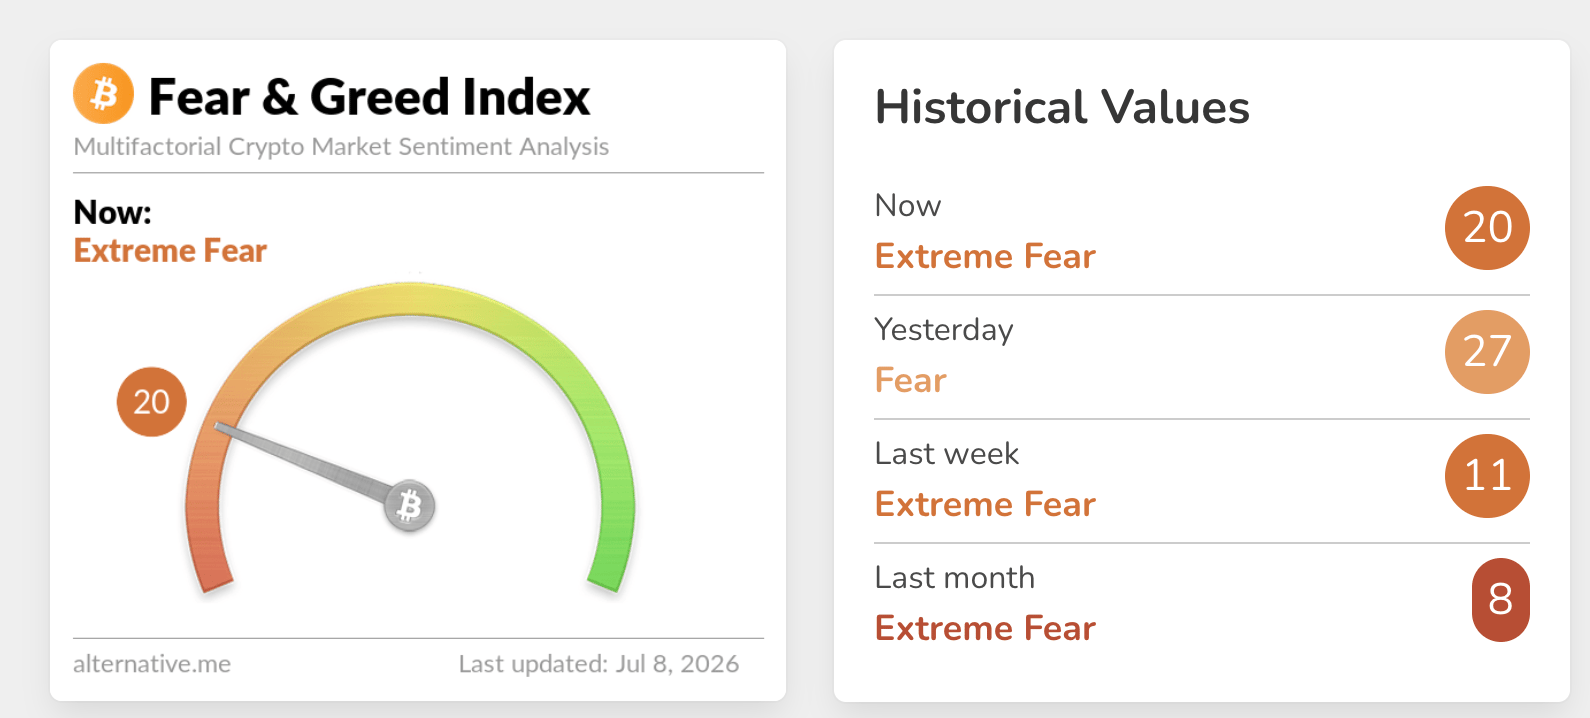
As tensions in the Middle East remain high, sentiment in the crypto market has deteriorated. At 20, embedded in the Extreme Fear territory, the crypto Fear & Greed Index shows that appetite for risk assets is significantly suppressed.
Bitcoin and Ethereum post mild ETF inflows
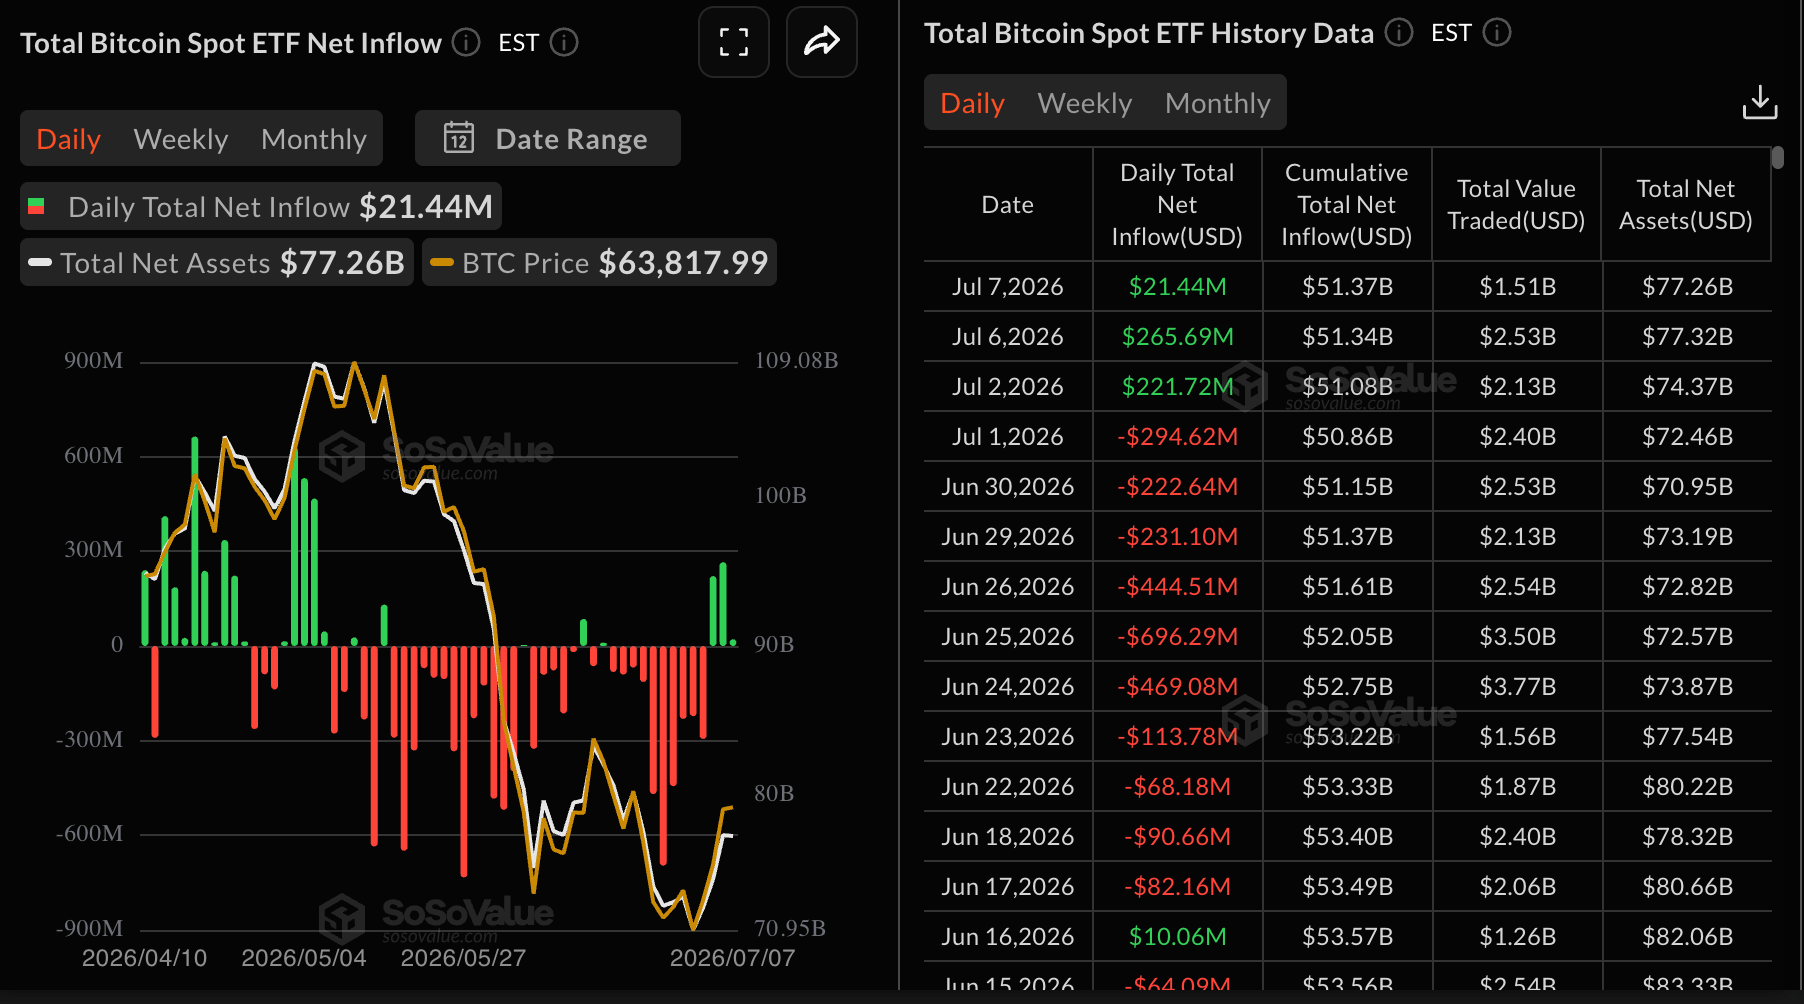
Bitcoin spot Exchange-Traded Funds (ETFs) saw inflows resume, attracting $21 million on Tuesday, down from $266 million on Monday. This drawdown mirrors investors’ concerns about tensions in the Middle East. Activity over the remaining days of the week would either reinforce the deteriorating sentiment or uphold a positive outlook. Besides, cumulative outflows stand at $51.37 billion, with net assets under management at $77.26 billion.
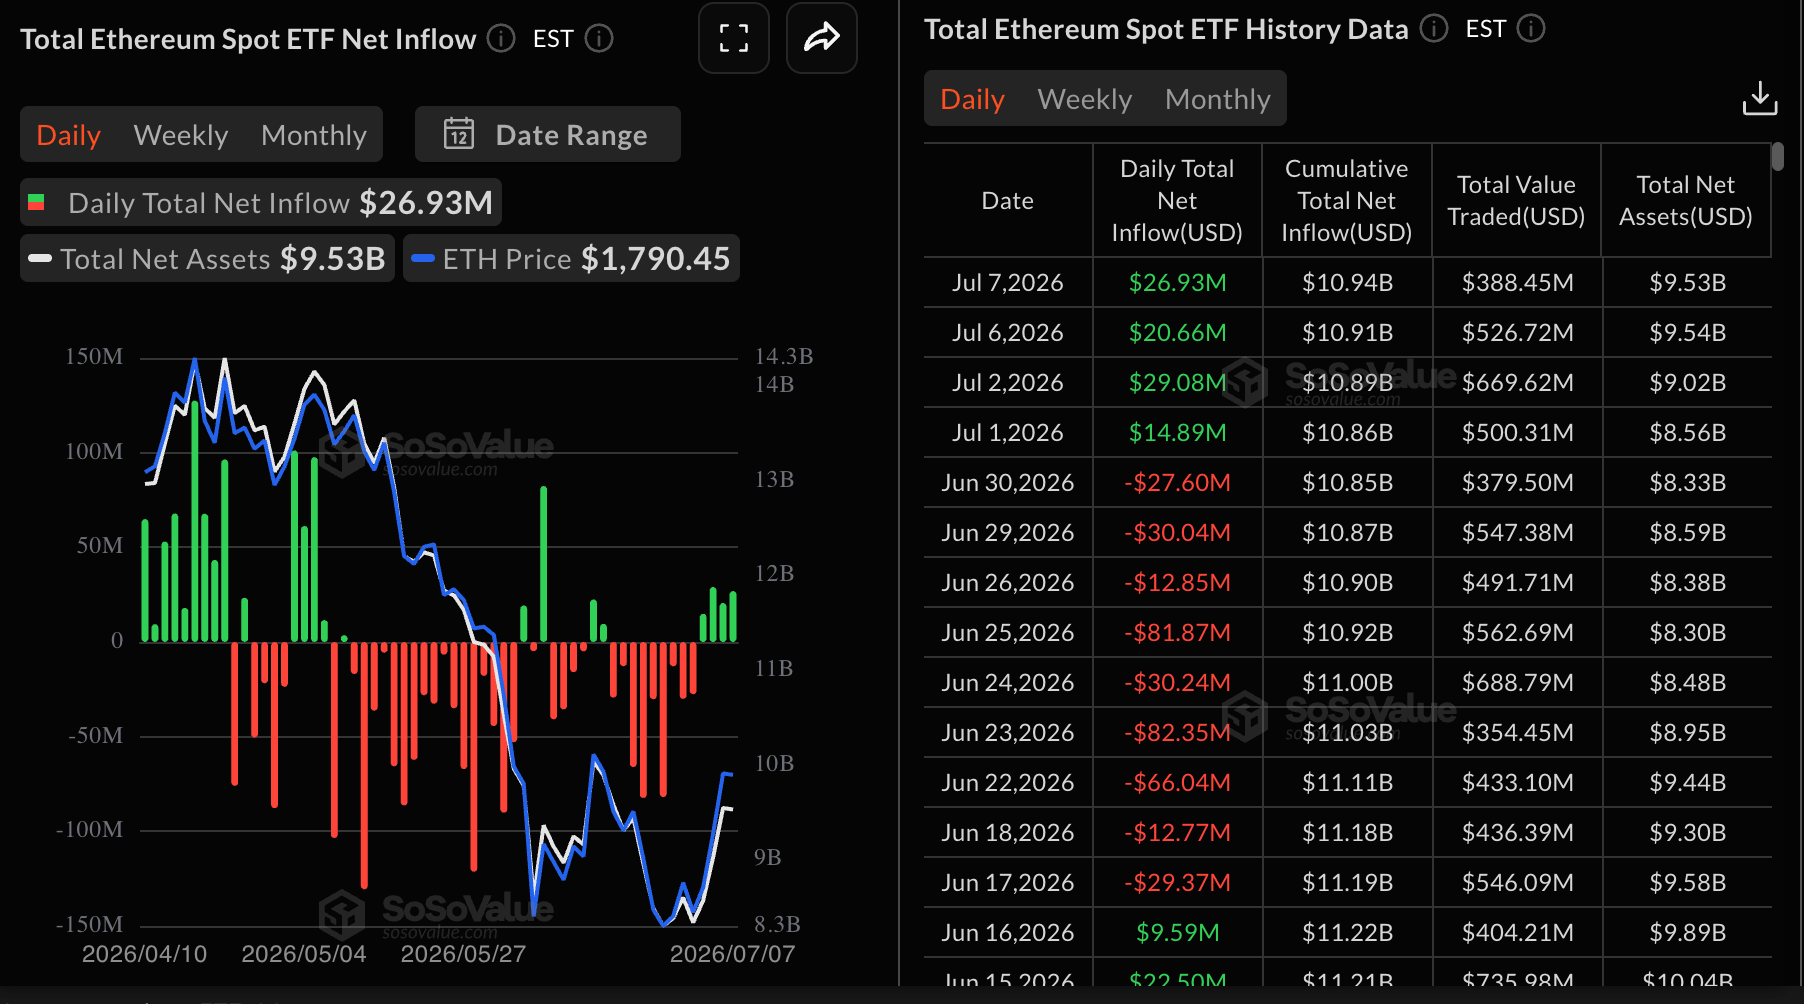
Ethereum ETFs similarly extended the mild inflow streak with nearly $27 million recorded on Tuesday, up only slightly from $21 million on Monday. Cumulative inflows average $10.94 billion, with net assets under management at $9.53 billion.
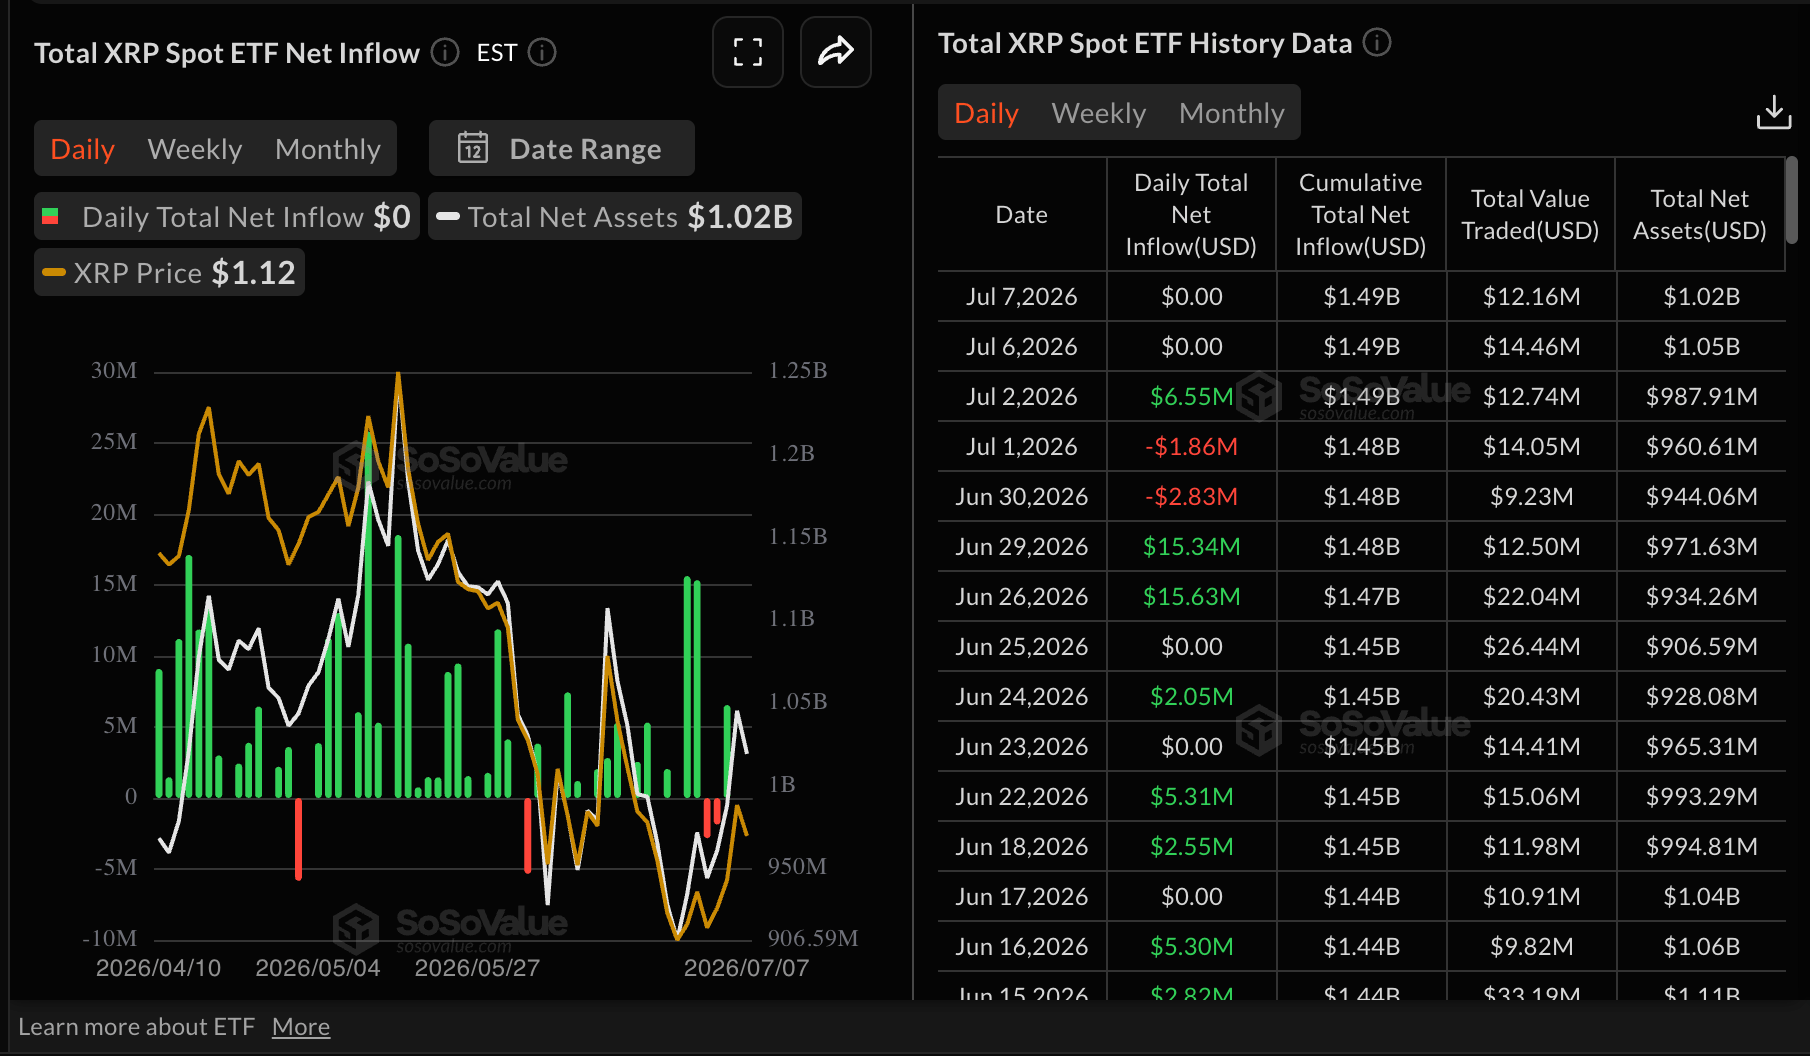
As for XRP, activity remained muted on Monday and Tuesday, according to SoSoValue data. This shows that while institutions appear to withdraw demand, long-term conviction in XRP remains intact, with cumulative inflows steady at $1.49 billion and net assets holding above $1 billion.
Price analysis: Bitcoin losses deepen, eyes short-term support
Bitcoin maintains a bearish near-term bias as the price remains well below the 50-day, the 100-day and the 200-day Moving Average Exponentials (EMAs). Moreover, the Crypto King is tracking a broader downward resistance trendline on the daily chart.
Momentum appears mixed, as the Relative Strength Index (14) around 45 leans slightly to the downside on the same chart, while the Moving Average Convergence Divergence (MACD) histogram stays positive, hinting that selling pressure is moderating rather than reversing decisively.
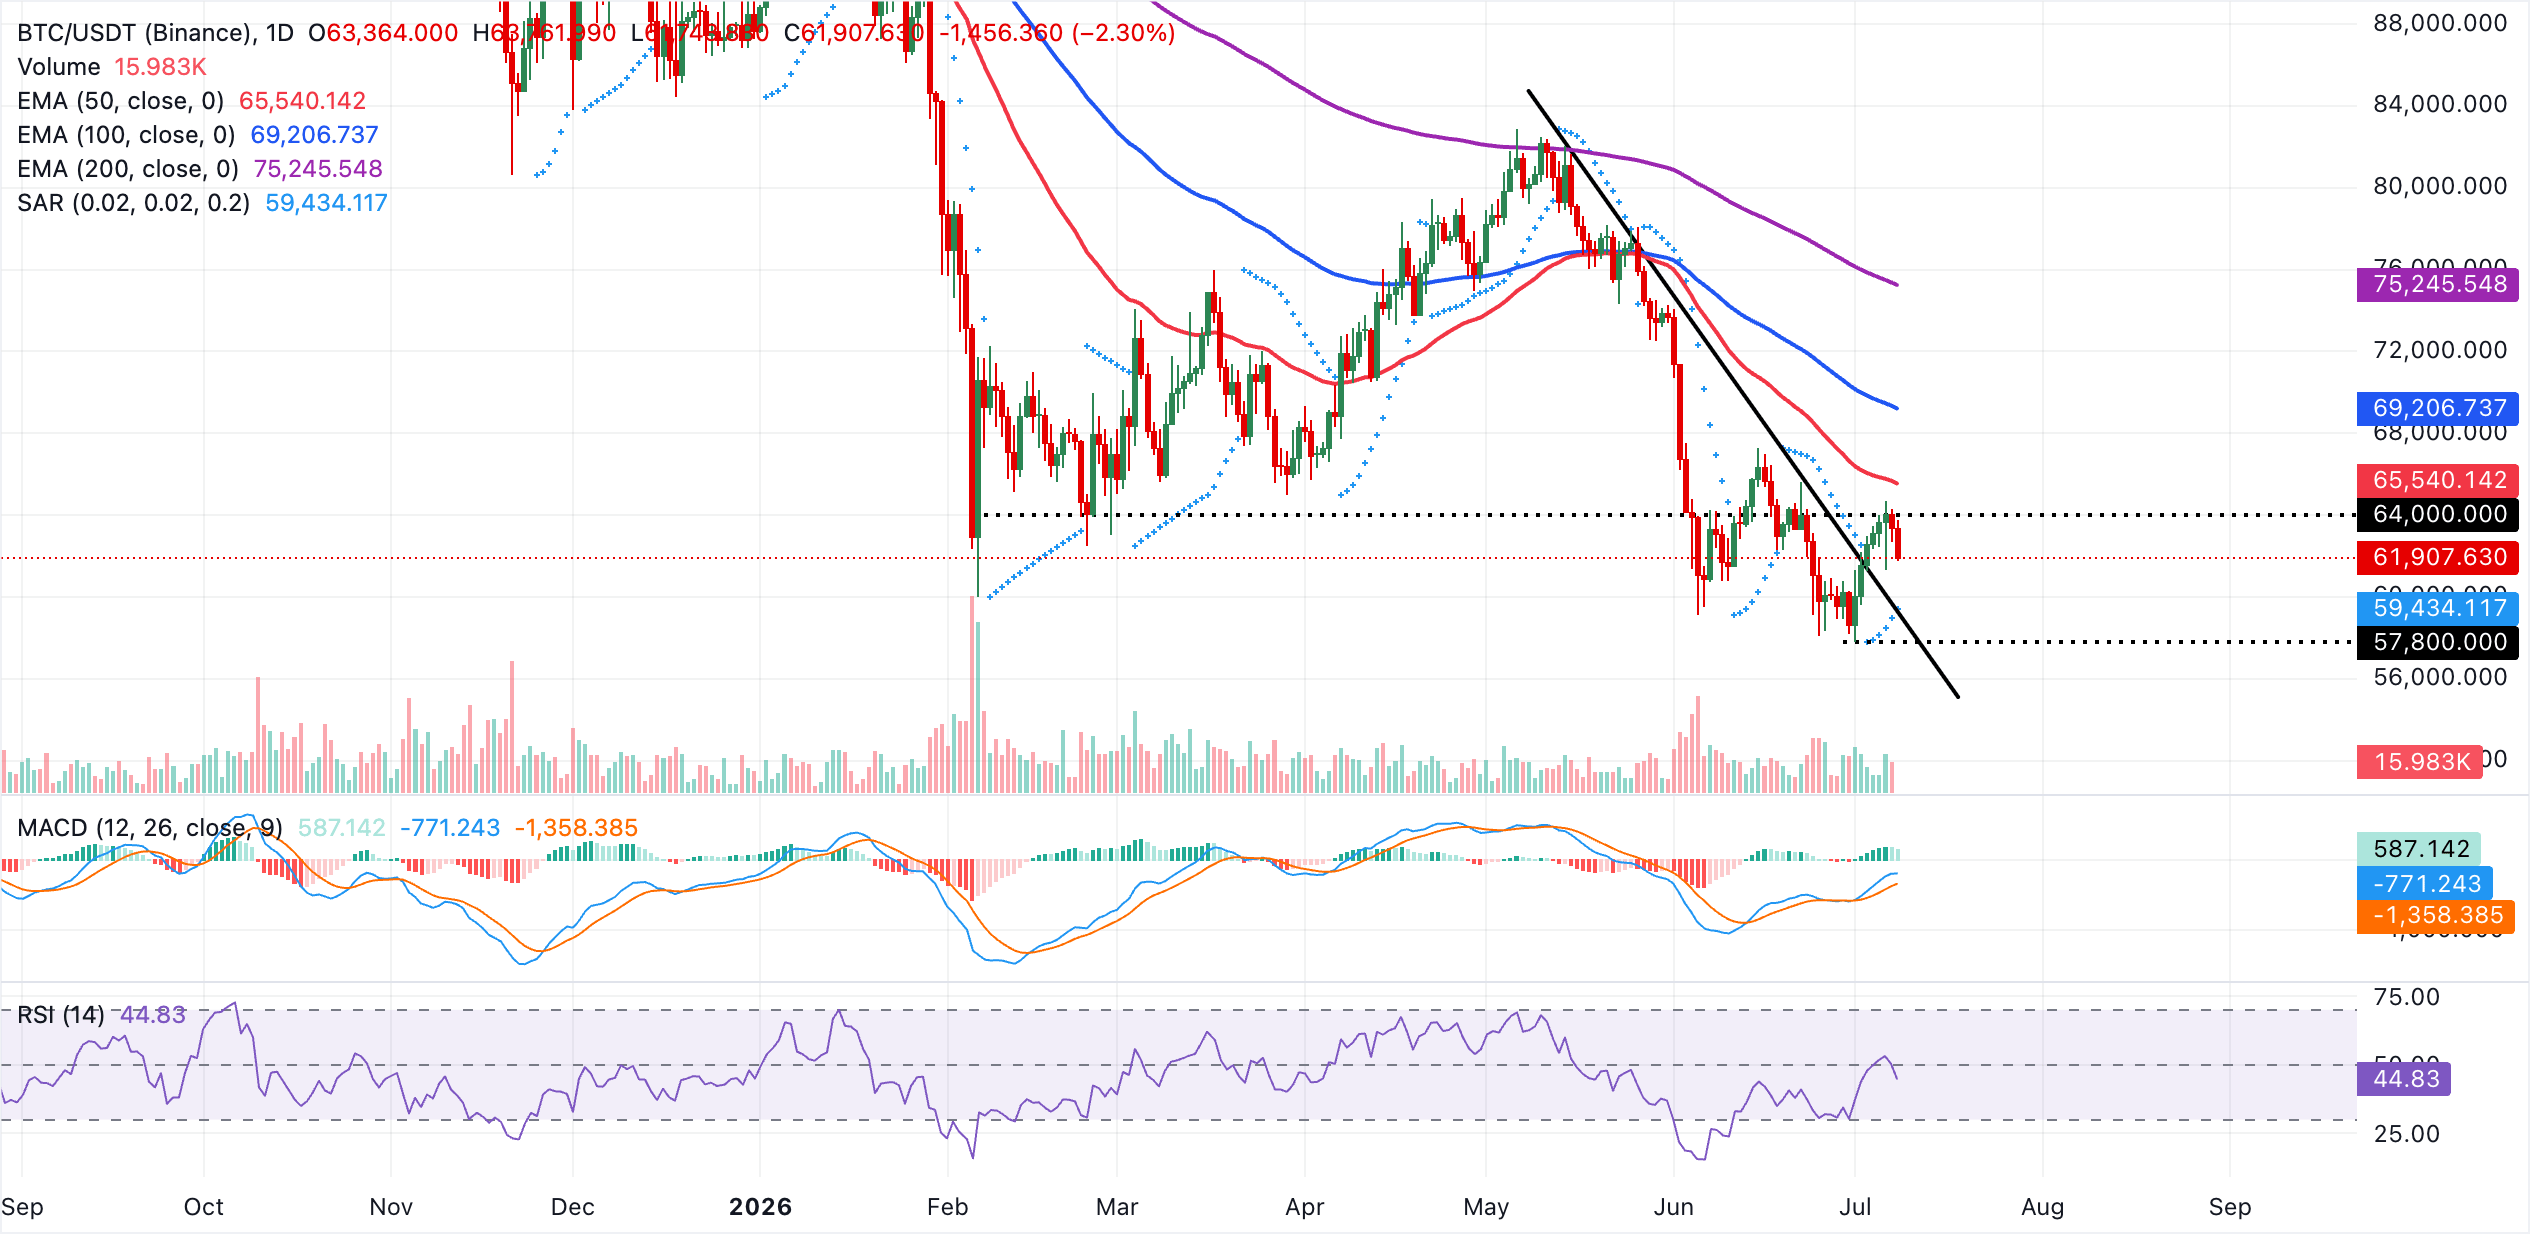
On the topside, initial resistance lies at the 50-day EMA near $65,540, with further supply layered at the 100-day EMA around $69,207 and the 200-day EMA close to $75,246, where the broader downtrend would be challenged. On the downside, first support emerges at the Parabolic SAR level around $59,434, followed by the prior trendline break price at $59,104, where buyers would need to step in to avoid a deeper slide toward the late-June lows.
Altcoins technical outlook: Ethereum and XRP remain under tight bearish grip
Ethereum trades at $1,738, maintaining a capped tone as it holds below the 50-day, 100-day and 200-day EMAs. Although momentum had improved with the MACD histogram in positive territory on the daily chart, the RSI has declined near the midline, suggesting that sellers are gaining traction.
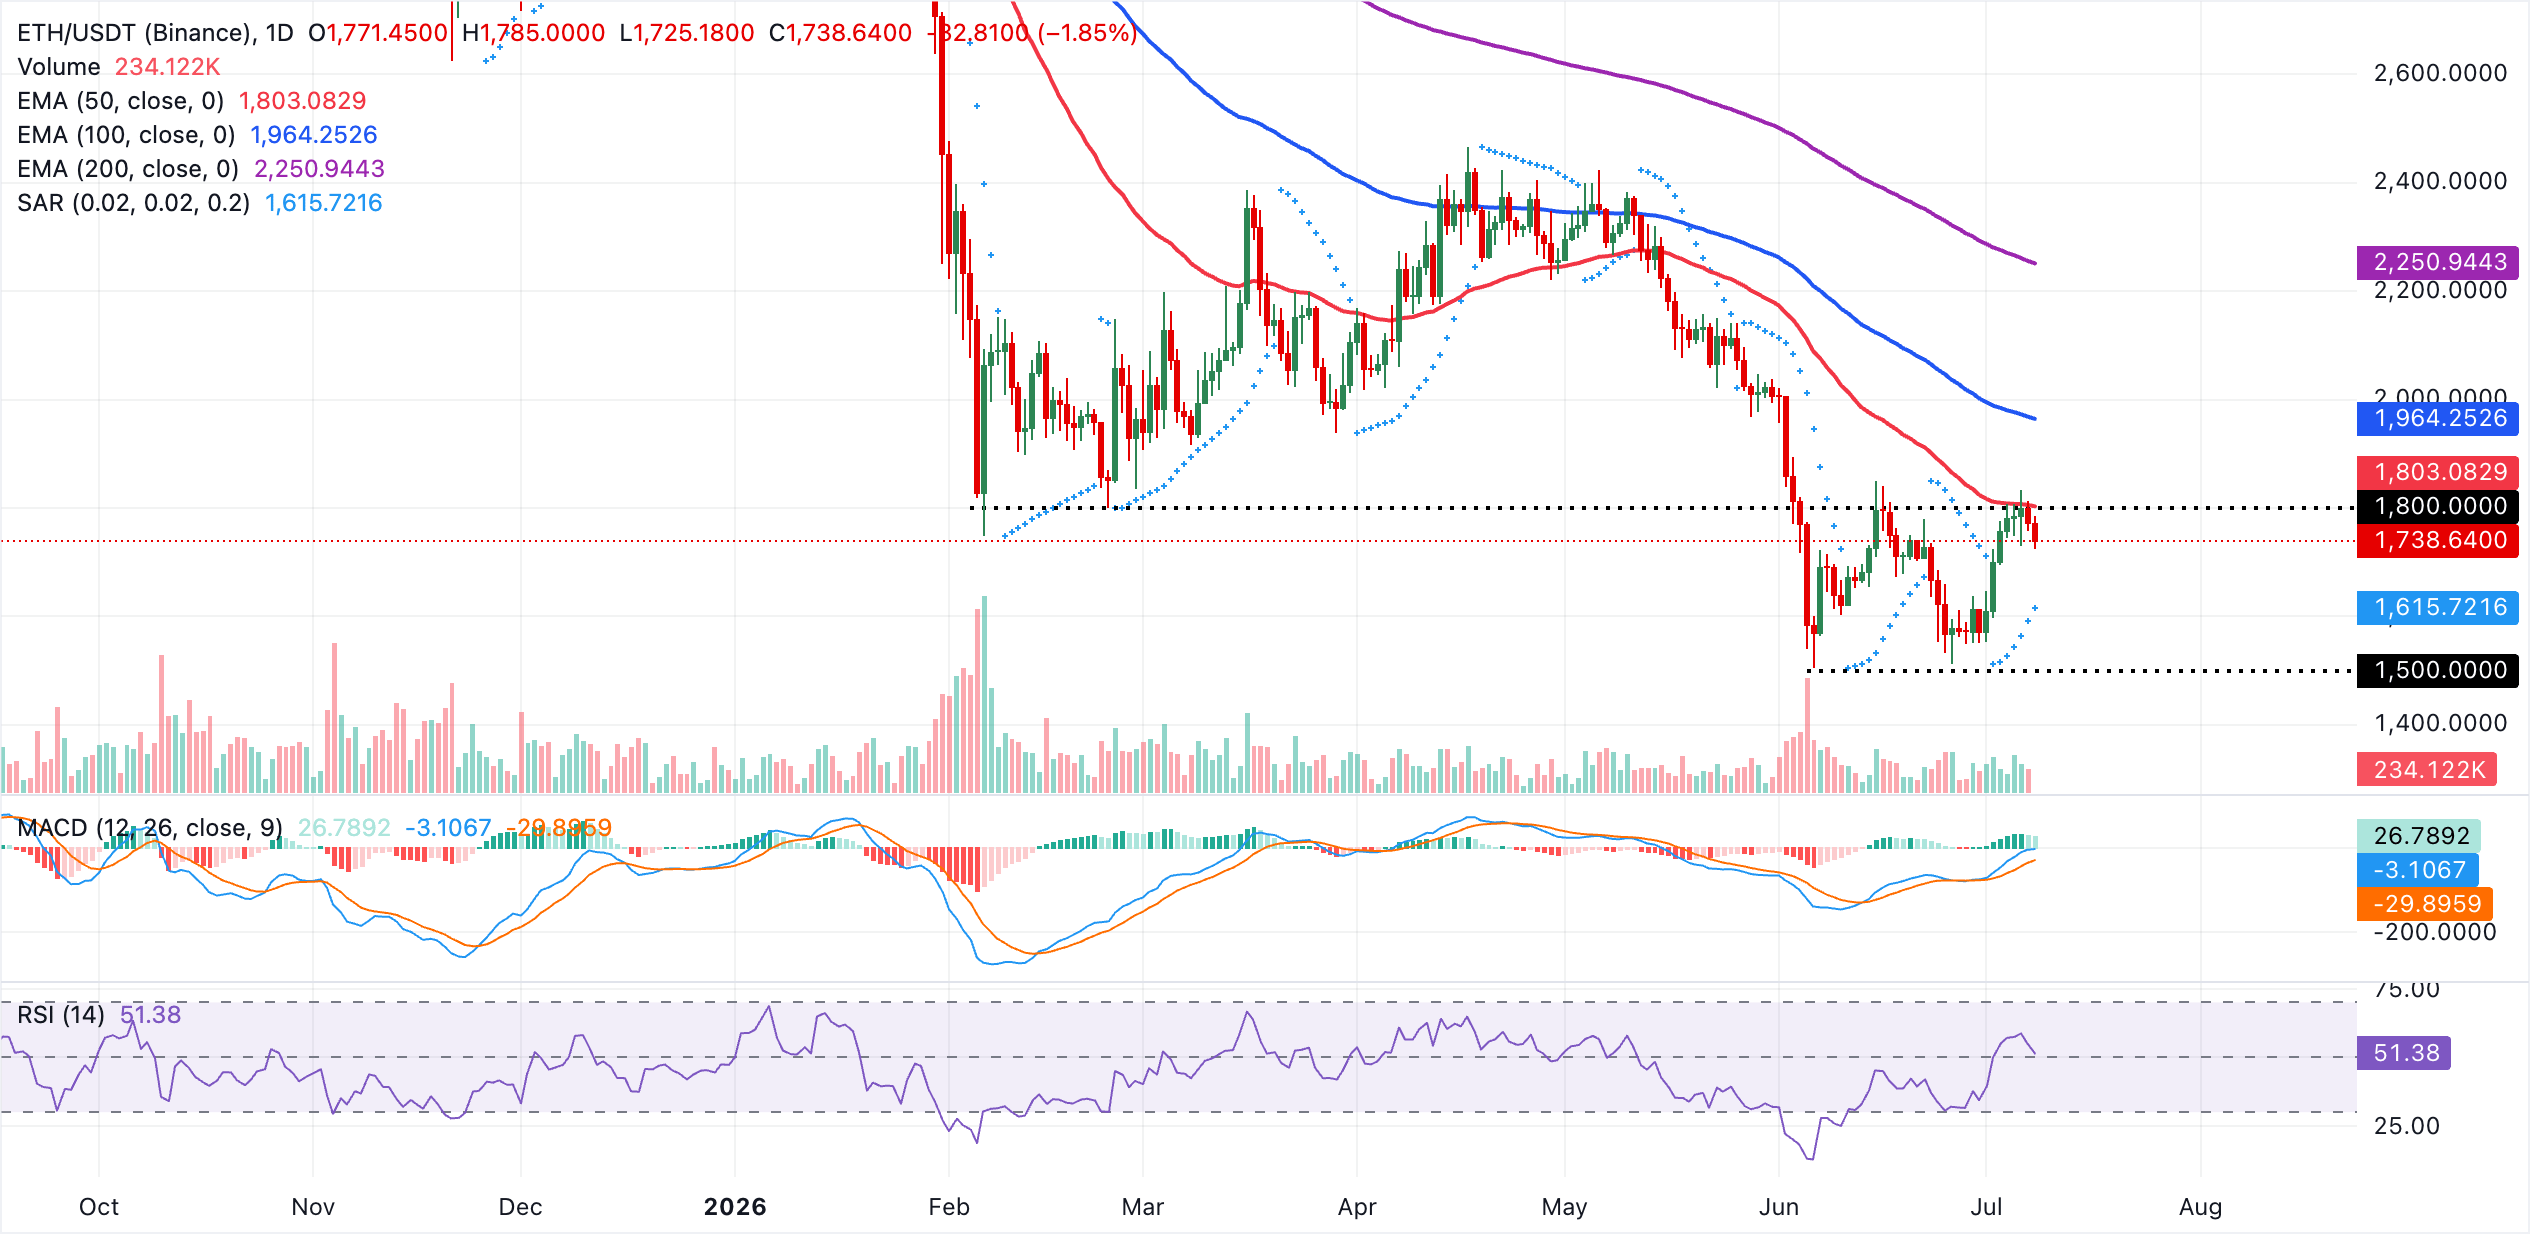
Immediate resistance lies at the 50-day EMA around $1,803, followed by the 100-day EMA near $1,964 and then the 200-day EMA around $2,251, where a reclaim would be needed to ease the broader downside pressure. On the downside, initial support lies at the current price area, with stronger underlying demand suggested by the Parabolic SAR level near $1,616. A daily close below this latter zone would likely reopen a deeper corrective phase.
XRP, on the other hand, maintains a bearish near-term bias. The token remains below the 50-day, 100-day and 200-day EMAs. The MACD indicator upholds a positive outlook on the daily chart. However, the RSI near 42 signals bears are tightening their grip.
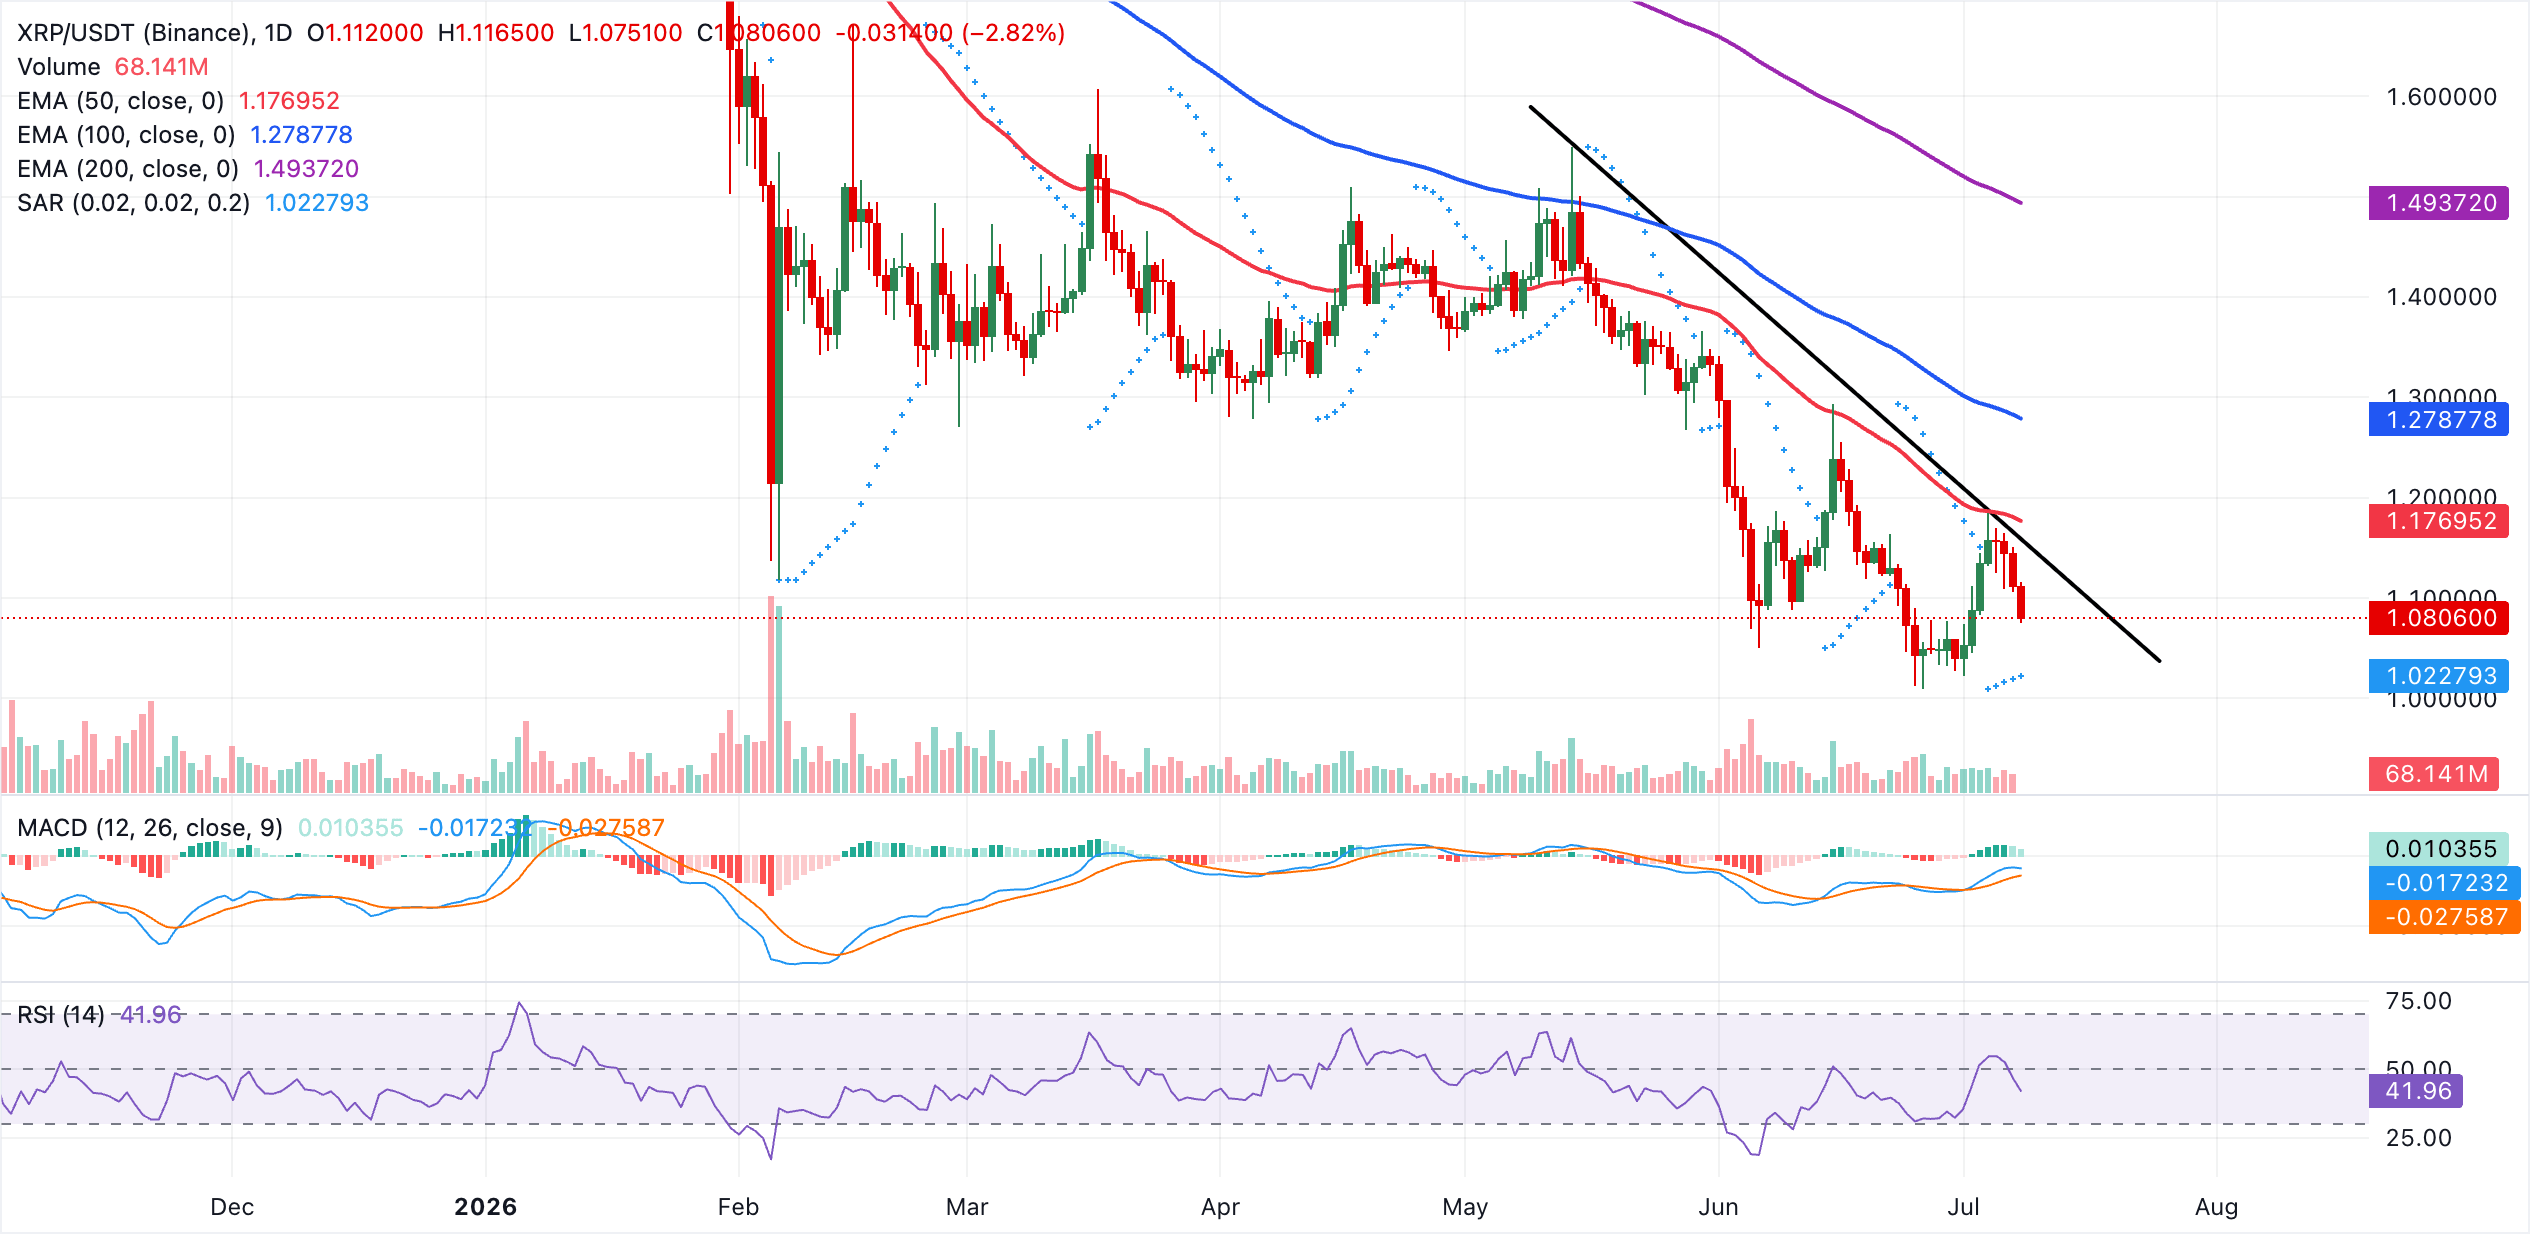
Initial resistance is seen at the descending trendline barrier around $1.16, followed by the 50-day EMA at $1.18, with the 100-day EMA at $1.28 and the 200-day EMA near $1.49 reinforcing a broader cap on recovery attempts. On the flip side, the first support sits at the Parabolic SAR level of $1.02. A daily close below this floor would open the way to a deeper retracement, while holding above it would keep XRP confined to a bearish but stabilizing range beneath the clustered EMAs.
(The technical analysis of this story was written with the help of an AI tool. Know more.)
Bitcoin, altcoins, stablecoins FAQs
Bitcoin is the largest cryptocurrency by market capitalization, a virtual currency designed to serve as money. This form of payment cannot be controlled by any one person, group, or entity, which eliminates the need for third-party participation during financial transactions.
Altcoins are any cryptocurrency apart from Bitcoin, but some also regard Ethereum as a non-altcoin because it is from these two cryptocurrencies that forking happens. If this is true, then Litecoin is the first altcoin, forked from the Bitcoin protocol and, therefore, an “improved” version of it.
Stablecoins are cryptocurrencies designed to have a stable price, with their value backed by a reserve of the asset it represents. To achieve this, the value of any one stablecoin is pegged to a commodity or financial instrument, such as the US Dollar (USD), with its supply regulated by an algorithm or demand. The main goal of stablecoins is to provide an on/off-ramp for investors willing to trade and invest in cryptocurrencies. Stablecoins also allow investors to store value since cryptocurrencies, in general, are subject to volatility.
Bitcoin dominance is the ratio of Bitcoin’s market capitalization to the total market capitalization of all cryptocurrencies combined. It provides a clear picture of Bitcoin’s interest among investors. A high BTC dominance typically happens before and during a bull run, in which investors resort to investing in relatively stable and high market capitalization cryptocurrency like Bitcoin. A drop in BTC dominance usually means that investors are moving their capital and/or profits to altcoins in a quest for higher returns, which usually triggers an explosion of altcoin rallies.
Source: Original Article