

























As the crypto market navigates through extreme fear territory, Ethereum price today sits near $1,768 — a level that places $ETH at a critical decision point between recovery and further downside.
Key takeaways
- $ETH trades at $1,768, caught between the 20-day EMA at $1,702 and the 50-day EMA at $1,805.
- The Fear & Greed Index reads 24, signaling extreme fear but also hinting at potential seller exhaustion.
- Daily MACD histogram shows building positive momentum despite the indicator line remaining in negative territory.
- $ETH must clear the $1,805–$1,830 resistance cluster to confirm any bullish shift in structure.
- DeFi activity is declining across major protocols, reducing gas demand and near-term price support.
The Daily Chart: Recovery Underway, But the Ceiling Is Close
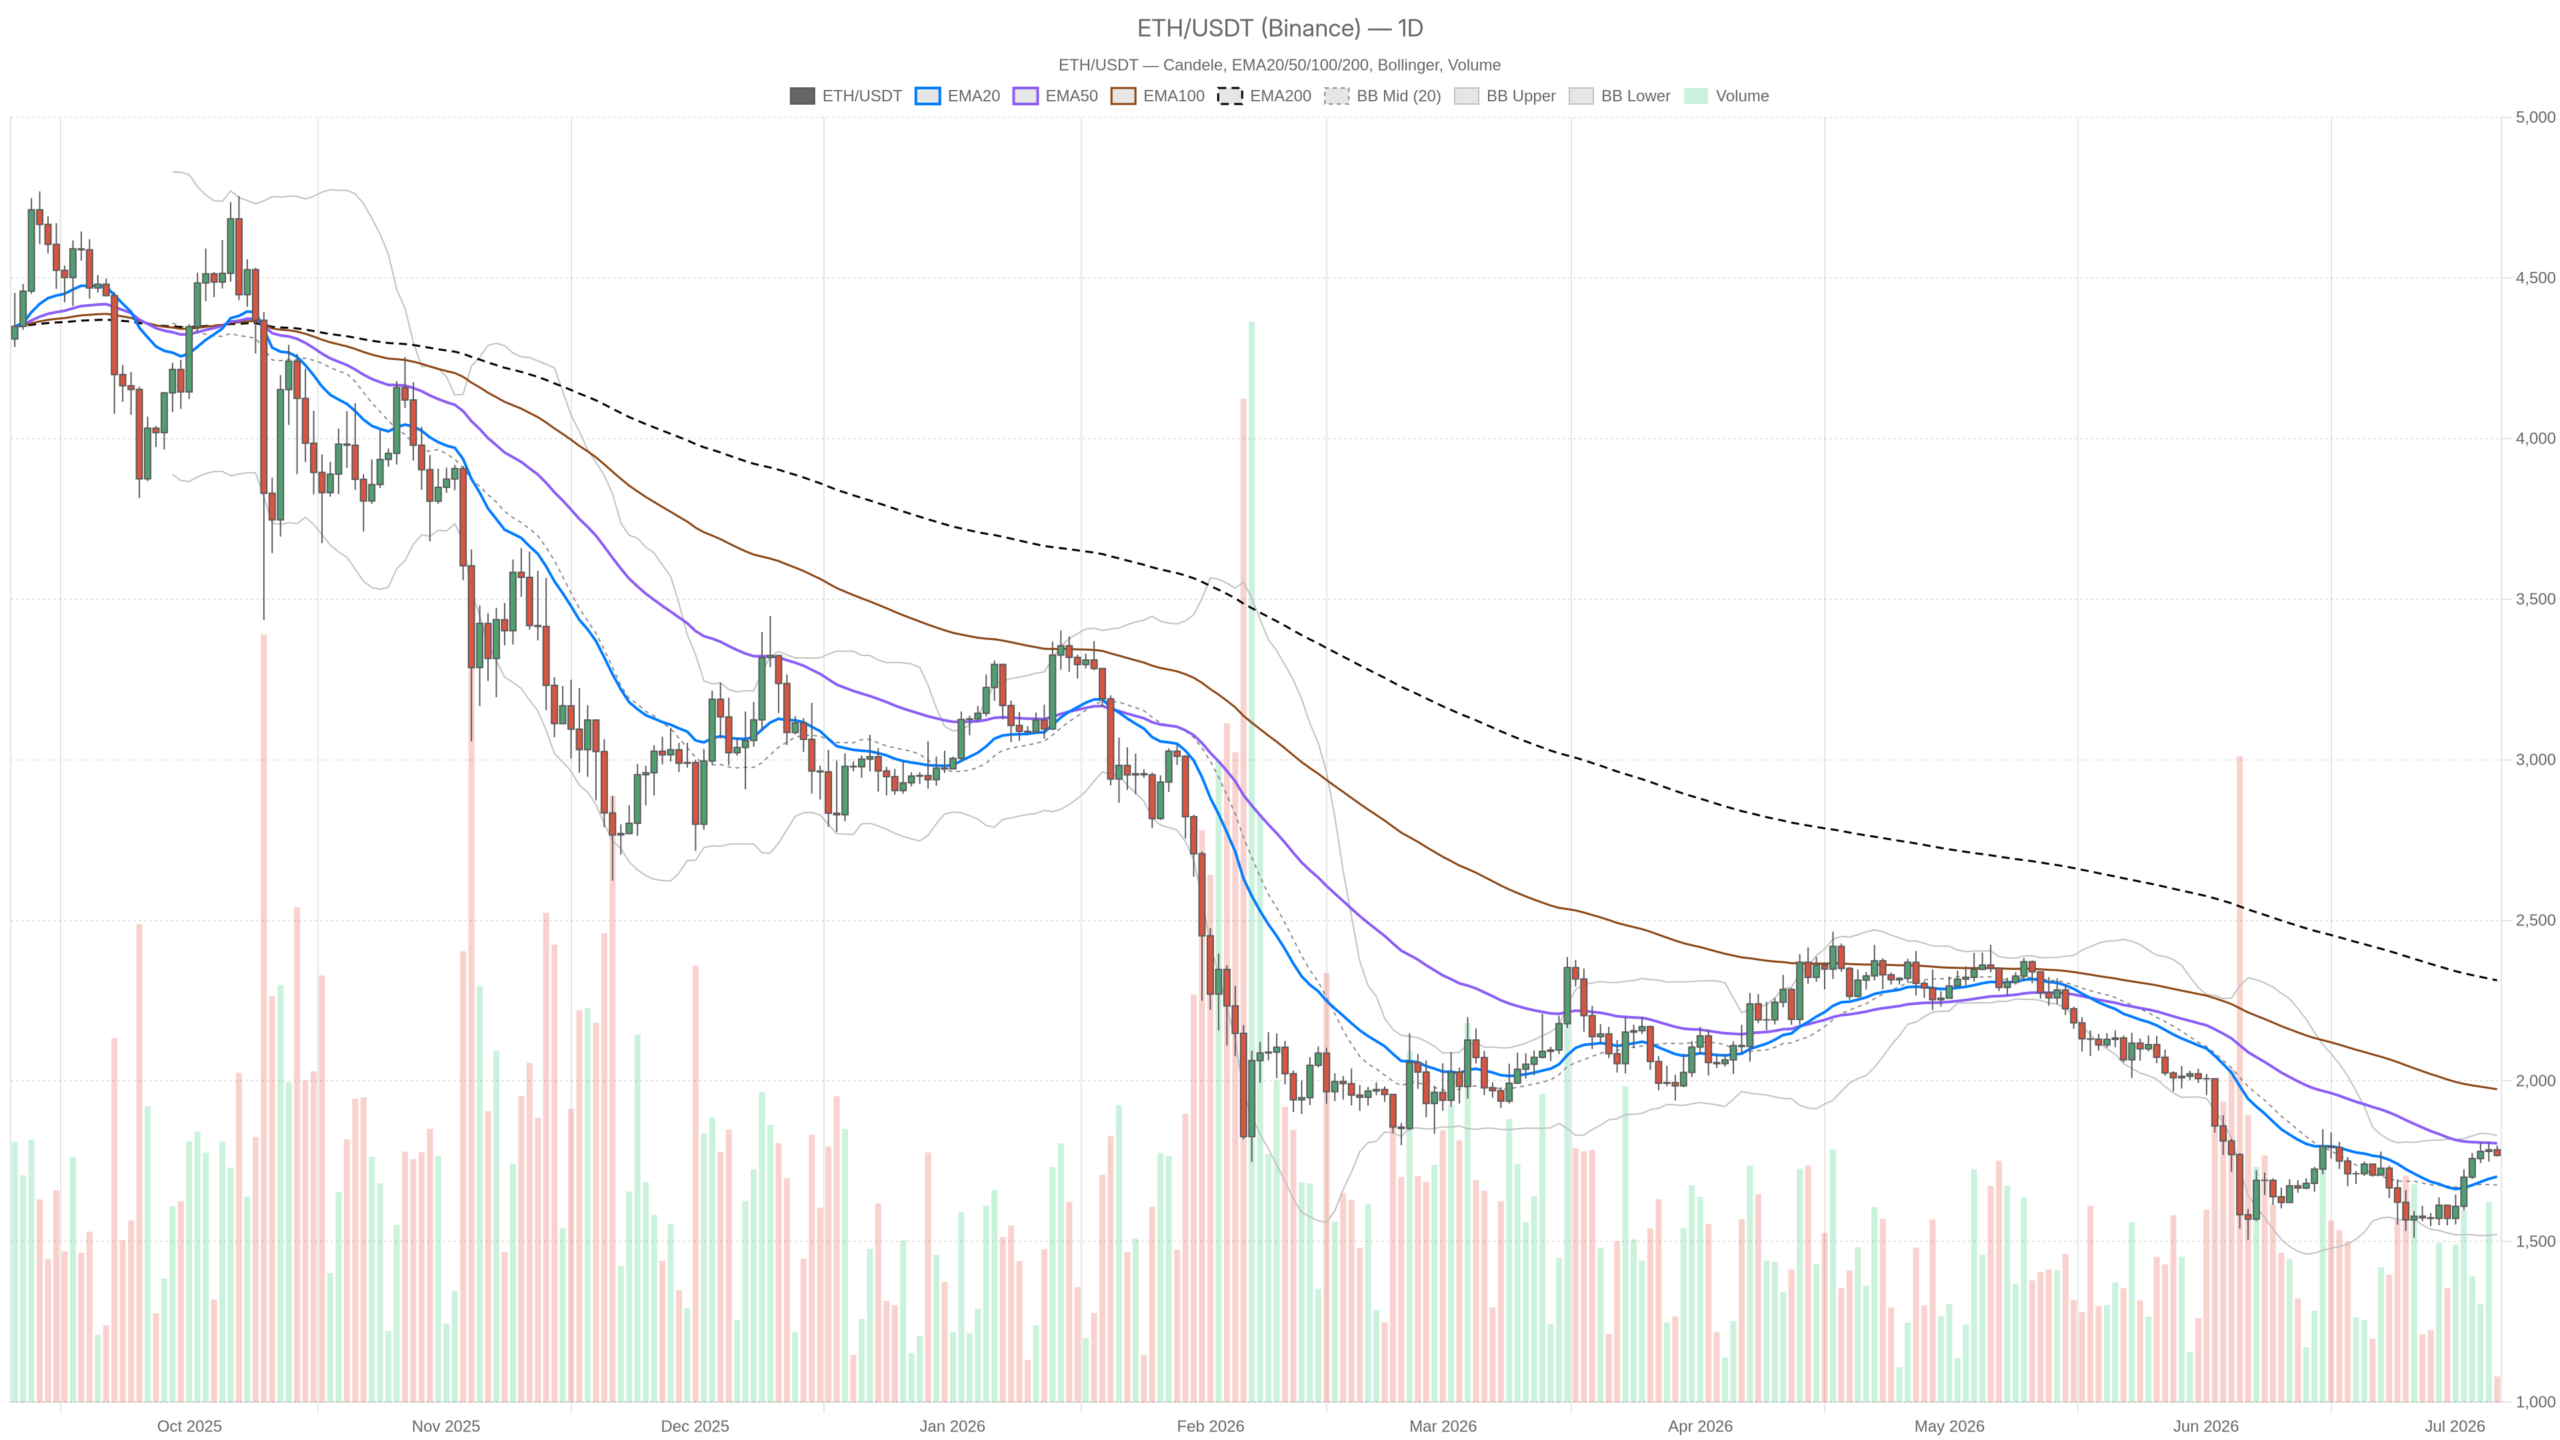
The daily chart tells a story of quiet accumulation against a wall of overhead resistance. $ETH is attempting to build a base above its 20-day EMA while the 50-day EMA at $1,805 remains the first structural barrier that must break for any recovery to gain credibility.
$ETH closed at $1,768.14, sitting above its 20-day EMA at $1,702 but below the 50-day EMA at $1,805. That gap between those two moving averages is where the battle is being fought. The 20 EMA has recently crossed above its recent lows and is curling upward — a short-to-medium term constructive sign. However, the 50 EMA overhead at $1,805 is the first real structural hurdle. The upper Bollinger Band at $1,830 sits just beyond it, creating a dense resistance cluster. $ETH needs to convincingly clear this zone before any recovery narrative has legs.
The 200-day EMA at $2,313 is a distant reminder of how far $ETH has fallen from its longer-term trend. This is not a market in recovery mode from a macro perspective. It is still deep in drawdown territory, and any trader calling a full trend reversal based on near-term action is getting ahead of themselves.
RSI on the daily sits at 55.4 — above neutral but nowhere near overbought. That leaves room to run without hitting an exhaustion ceiling. The MACD tells a more nuanced story. The line at -13.54 is still in negative territory, but the histogram has printed a strong positive divergence at +31.41. This means momentum is building beneath the surface even if price has not broken out yet. It is the kind of setup where patient bulls find their footing — not explosive, but quietly accumulating energy.
The daily ATR of $82 keeps this in perspective. Any given day can swing over $80 without anything significant happening by recent standards, so loose stops get punished. The daily pivot at $1,777 is essentially where $ETH is trading right now. R1 at $1,789 and S1 at $1,755 define an extremely tight near-term range, reinforcing the idea that the market is coiling rather than trending.
Hourly Picture: Short-Term Pressure Has the Upper Hand
On the 1H timeframe, sellers hold a mild but clear advantage. $ETH is trading below its short-term moving average cluster, with the hourly MACD and RSI both pointing downward, suggesting that immediate upside attempts will face friction.
$ETH is trading at $1,768 but the 20 EMA sits at $1,776 and the 50 EMA at $1,767. The price has slipped below this short-term moving average cluster, which is a mild bearish lean on the intraday timeframe. Moreover, the Bollinger Band midline at $1,778 is also above current price, confirming that the path of least resistance intraday is down, not up.
Hourly RSI at 42.93 is approaching the lower end of neutral — not yet oversold, but the directional lean is clearly downward. The MACD histogram at -2.12 corroborates this: momentum is fading on the short-term. This is not a collapse, but it does mean anyone looking for an immediate long entry on the 1H should be cautious about timing. The daily bias may be neutral-to-bullish, but the hourly is quietly softening.
One constructive element worth noting: the 1H 200 EMA is at $1,696 — well below current price. $ETH has maintained a healthy gap above its long-term hourly average. That suggests the macro intraday structure remains intact even if near-term momentum has turned mildly sour.
15-Minute Chart: Execution Noise, Nothing More
The 15-minute frame is not delivering a macro signal, but it does matter for trade execution. All three EMAs — 20 at $1,776, 50 at $1,778, and 200 at $1,769 — are stacked above current price. Meanwhile, the RSI at 39 is drifting toward oversold without quite reaching it. The MACD histogram at -0.73 is barely negative, suggesting the short-term selloff is losing steam but has not yet reversed.
For anyone trying to time an entry, the 15m suggests we are in the late stages of a micro pullback. A bounce back toward $1,775–$1,780 would not be surprising, but chasing it without a daily catalyst would be speculative.
DeFi Activity: The On-Chain Layer Adds Context
On-chain data from DefiLlama confirms that decentralized exchange activity is contracting sharply. Uniswap V3 and V4 combined remain the dominant fee-generating venues in DeFi, though daily fees across the board are down significantly — Uniswap V3 dropped 15.5% in one day, and Curve slid over 21%.
The 30-day fee trend is down across virtually every major DEX, with some protocols seeing 80–90% monthly declines. That is not a sign of a thriving on-chain economy. Lower DEX activity generally correlates with reduced $ETH demand from gas-intensive activity, which does not help the near-term price case. The one outlier is Ekubo, which saw fees surge 328% over seven days — a curiosity, but too small to move the needle for $ETH broadly.
The Bullish Scenario
A daily close above the 50-day EMA at $1,805 with volume confirmation would shift the regime from neutral to tentatively bullish. The MACD histogram divergence on the daily is already building the case for such a move. A sustained hold above $1,805 would open the door toward the upper Bollinger Band at $1,830, and beyond that, the psychological $1,900–$2,000 zone becomes the next logical target.
The Fear & Greed reading at 24 also sets a contrarian backdrop: if sentiment flips even marginally, a short-squeeze-driven move higher could accelerate quickly. This scenario gets invalidated if $ETH fails at the $1,805–$1,830 cluster and turns it into resistance again. A rejection there, especially with declining volume, would suggest the current bounce is corrective rather than the start of a new leg.
The Bearish Scenario
A loss of the daily S1 at $1,755 on a closing basis would be the first warning signal for bears to press their advantage. Below that level, the 20-day EMA at $1,702 becomes critical support. If that gives way — particularly if Bitcoin dominance at 55.7% continues to rise, siphoning flow away from altcoins — $ETH could revisit the lower Bollinger Band near $1,521.
That is not a base case, but with DeFi fees collapsing and sentiment already at extreme fear, the absence of a catalyst could keep $ETH grinding lower. This bearish read gets invalidated by a clean break and close above $1,830, which would signal that buyers have genuinely absorbed the overhead supply.
Positioning and the Risk Reality
The Ethereum price today reflects a market in decision mode rather than one offering easy answers. The daily setup has enough positives — building MACD momentum, RSI above 50, price holding above the 20 EMA — to keep bulls interested. However, the hourly headwinds, the hostile macro sentiment, the weak DeFi fee environment, and the fortress of resistance between $1,805 and $1,830 mean this is not a moment for aggressive, unchecked exposure.
The daily ATR of $82 is the honest risk-management benchmark here. Anyone sizing a position in $ETH right now needs to respect that number. A tight stop below $1,755 gives a defined risk level against a move toward $1,830 — that is roughly a 1:1 risk/reward at best, which is not generous enough to justify large size unless confirmation comes first.
Watch the $1,805 level. If $ETH takes it and holds it, the structure changes. Until then, this is a market worth monitoring with patience rather than pressing with conviction.
FAQ
What are the key resistance levels for Ethereum right now?
The immediate resistance cluster sits between $1,805 and $1,830. This zone contains the 50-day EMA at $1,805 and the upper daily Bollinger Band at $1,830. A clean break above this range would open the path toward the $1,900–$2,000 area.
What does the Fear & Greed Index at 24 mean for $ETH?
A reading of 24 places the market deep in extreme fear territory. While this does not guarantee a bottom, it often indicates that the marginal seller is increasingly exhausted. Historically, such levels have created contrarian opportunities when combined with improving technical signals.
Is Ethereum in a bullish or bearish trend right now?
On the daily timeframe, $ETH is in a neutral-to-slightly-bullish posture — above its 20-day EMA but below its 50-day EMA. The intraday hourly chart leans mildly bearish. The market is coiling rather than trending, and the resolution above $1,805 or below $1,755 will likely define the next directional move.
Disclaimer: This article is for informational purposes only and does not constitute financial advice, an investment recommendation, or a solicitation to buy or sell any financial instrument or cryptocurrency. The analysis provided is not indicative of future results. Investing in crypto assets and financial markets carries a high risk of capital loss. Always do your own research (DYOR) and consult a qualified financial advisor before making any decision.
Article produced with the assistance of artificial intelligence and reviewed by the editorial team.
Source: Original Article