





















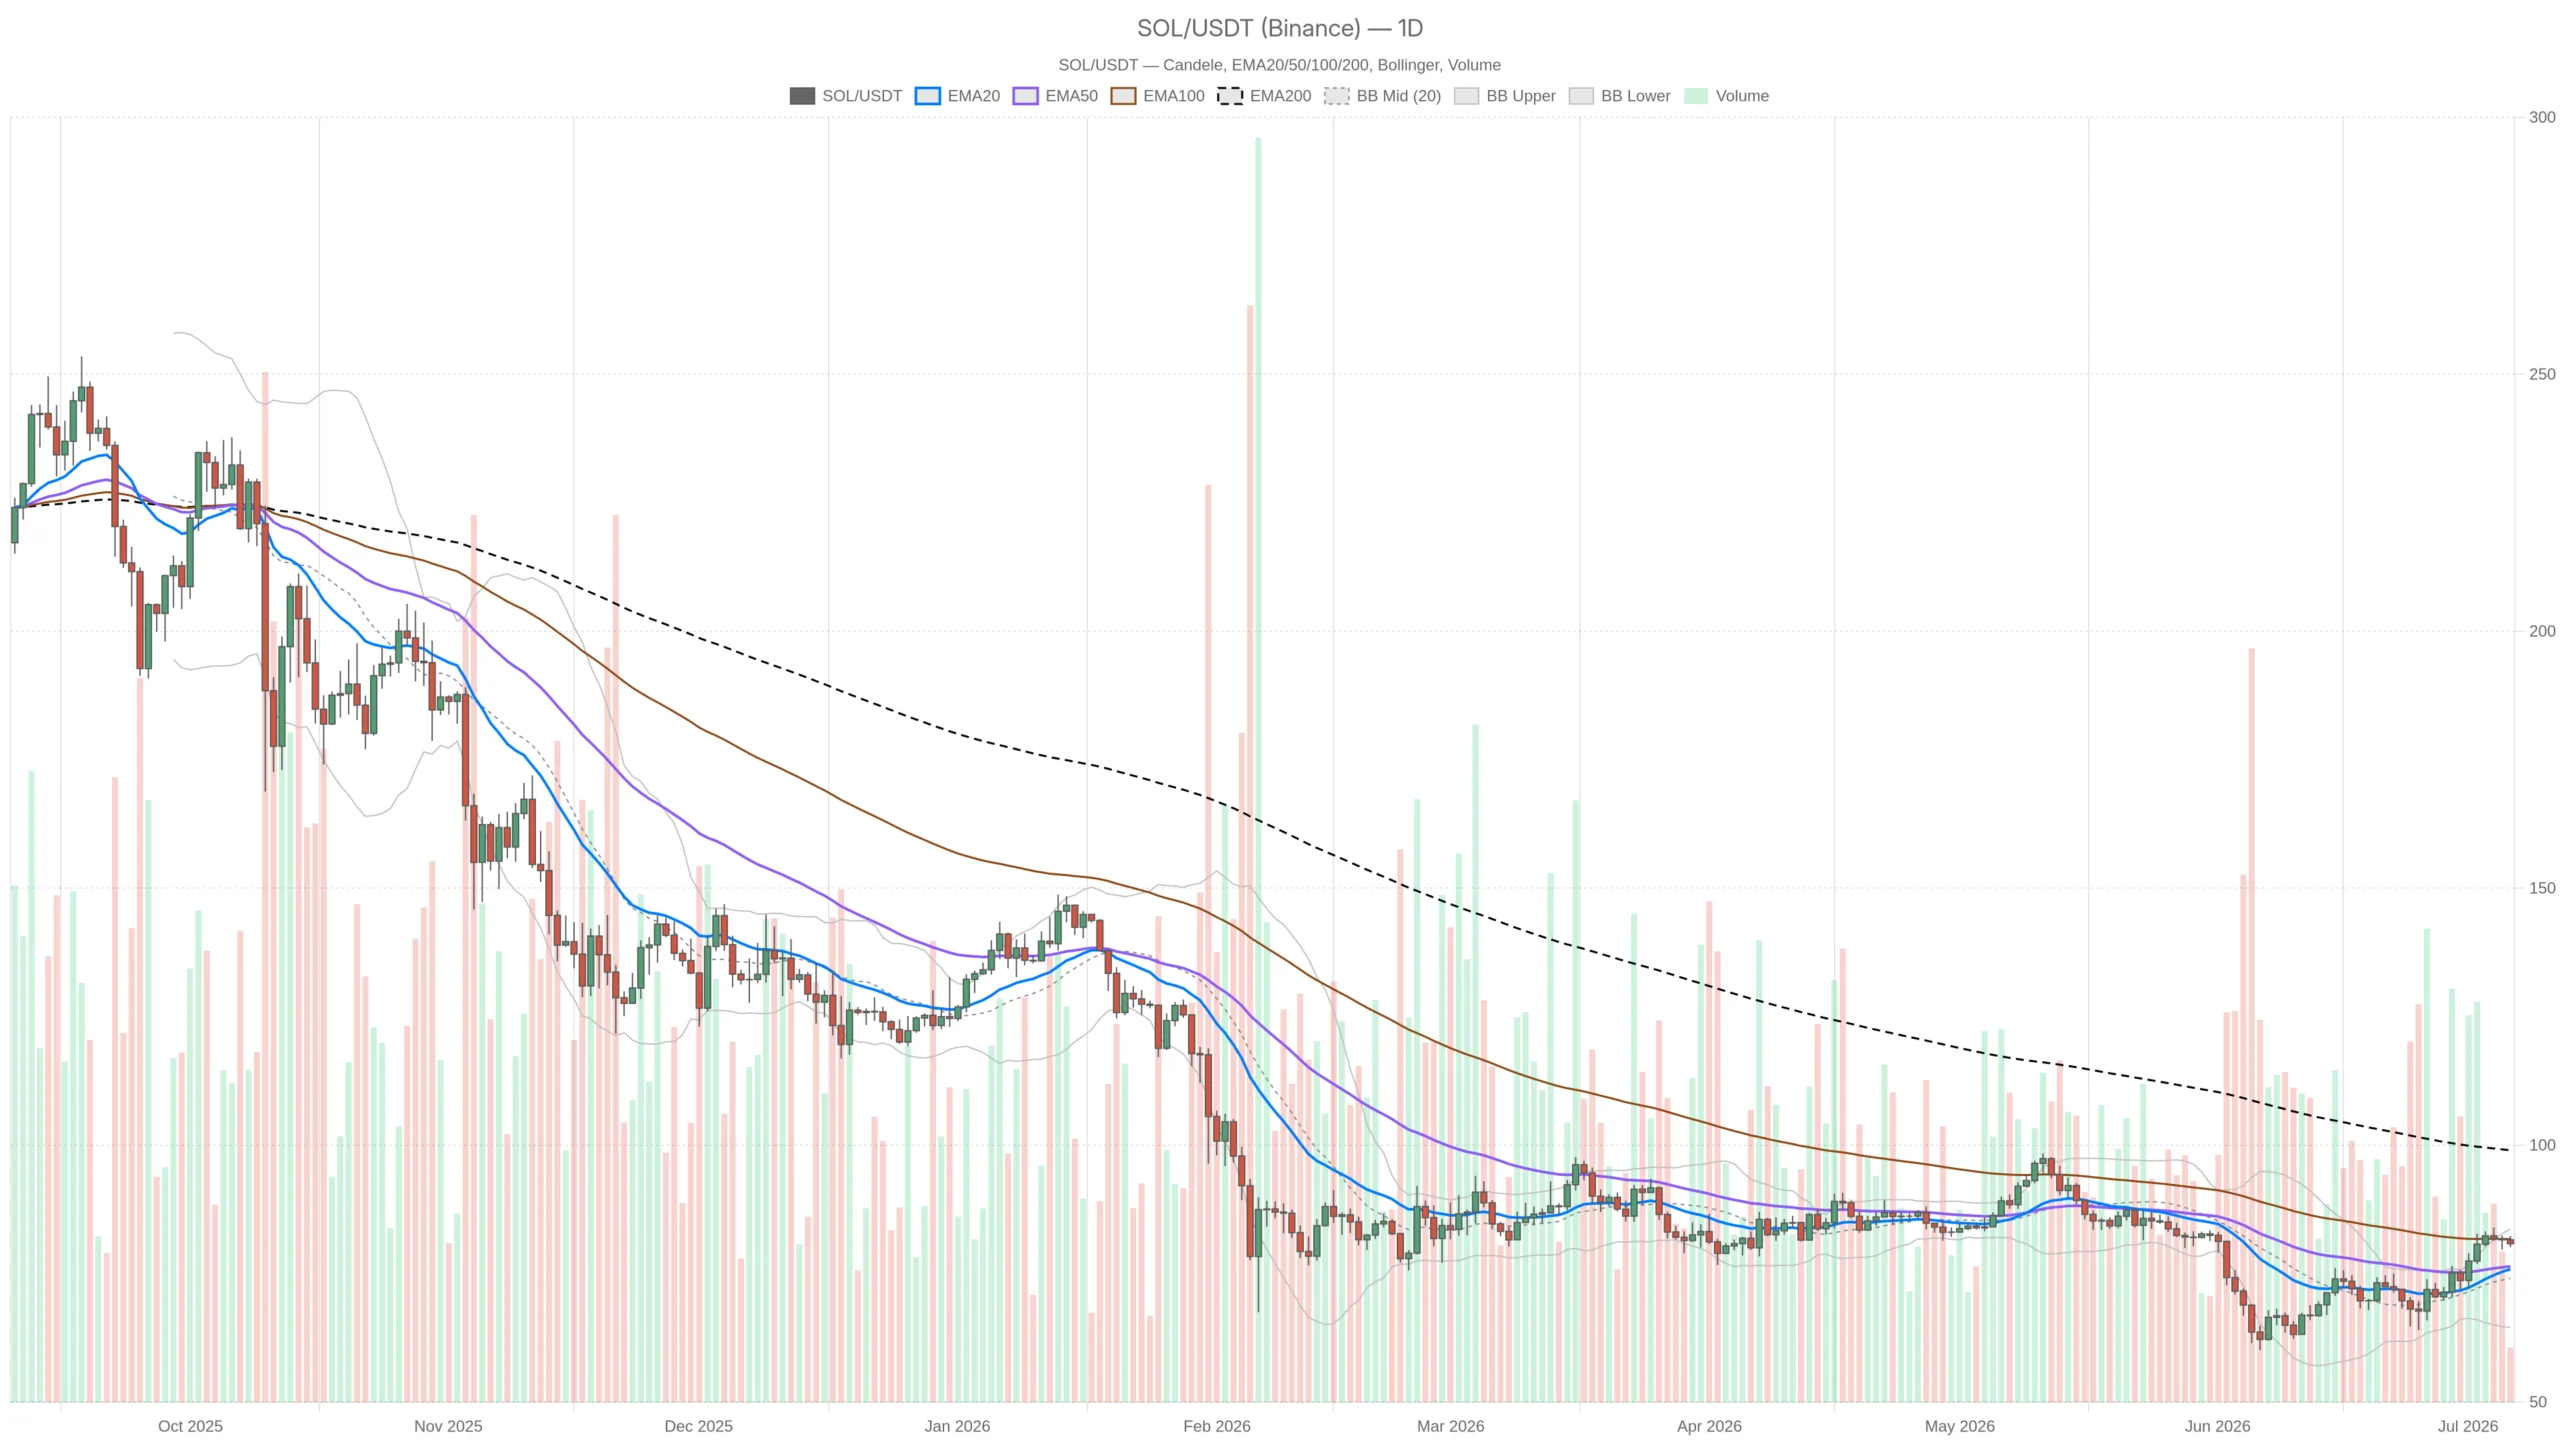
Solana is trading at $80.86 in early July 2026, a level that appears unremarkable at first glance. Yet the structure reveals a market at a genuine crossroads. The Solana price today sits above both the 20-day and 50-day EMAs, pressing against the upper half of its daily Bollinger Band.
Key takeaways
- SOL trades at $80.86, holding above the 20-day EMA ($75.88) and 50-day EMA ($76.42) on the daily timeframe.
- The daily MACD shows a clear bullish cross with expanding momentum, printing a histogram of 1.40.
- Hourly indicators reveal softening momentum with RSI at 46.73, signaling near-term distribution pressure.
- The 200-day EMA sits at $99.00, a significant overhead resistance 22% above the current price.
- The broader market remains in Extreme Fear territory, with the Fear & Greed Index at 24 and BTC dominance at 55.7%.
The Daily Timeframe: Structurally Recovering, Not Yet Confirmed
The daily chart presents the most constructive picture across all timeframes examined. SOL closed at $80.83, holding comfortably above the 20-day EMA at $75.88 and the 50-day EMA at $76.42. The Solana price today reflects a genuine recovery, with the asset trading roughly $4–5 above both short-term moving averages. The EMAs are beginning to converge and tick upward, signaling early trend resumption rather than a dead-cat bounce.
The daily MACD reinforces this outlook. The line is printing at 2.12 against a signal of 0.72, producing a histogram of 1.40. That is a clear bullish cross with expanding momentum. Crosses like this on the daily, especially when the histogram is widening, tend to precede sustained directional moves. The RSI at 61.88 sits in healthy bullish territory: not overbought and not threatening a reversal, with room to climb toward 70.
The Bollinger Bands place the current price almost exactly between the midline ($74.10) and the upper band ($83.66). That positioning matters. Price is in the upper half of the range, which statistically favors continuation in a trending environment. The upper band at $83.66 acts as the natural short-term ceiling. A sustained close above it would signal a volatility expansion to the upside. The daily ATR at $4.42 means any meaningful move, in either direction, will cover real ground quickly.
The daily pivot cluster tells a tight story: PP at $81.10, R1 at $82.06, S1 at $79.88. SOL is essentially parked on the pivot point, a zone that tends to act as a fulcrum. A daily close above $82.06 opens the path toward the upper Bollinger Band and beyond. However, a failure below $79.88 shifts the immediate narrative back toward the midpoint of the range.
One caveat on the daily chart deserves attention: the 200-day EMA sits at $99.00, a full 22% above the current price. That is significant overhead. It signals that whatever recovery Solana has staged, it has not yet reclaimed its long-term structural mean. The macro trend, by that measure, remains technically bearish. Bulls need to respect that ceiling.
The Hourly Chart: Where the Cracks Start to Show
The hourly timeframe tells a different story, with short-term momentum fading and price slipping below key intraday moving averages. SOL at $80.86 is sitting below both the 1H EMA20 ($81.05) and the EMA50 ($81.13), a subtle but meaningful inversion. It indicates the short-term trend has flipped slightly bearish relative to the daily impulse. The 1H EMA200 at $78.09 remains well below price, so the medium-term structure stays intact. However, the recent sessions have been distributing rather than accumulating.
The 1H MACD confirms the hesitation. The line is at -0.13, below its signal at -0.05, with a negative histogram of -0.08. Nothing catastrophic, but this kind of reading suggests the easy money from the recent push has already been made. Traders who bought the breakout above $76 are sitting on gains, and some are trimming. The RSI at 46.73 on the hourly is the most telling number: barely sub-50, not oversold, not signaling reversal. It is simply drifting — the hallmark of early distribution.
Hourly Bollinger Bands reinforce the compression: upper at $82.08, lower at $80.26, mid at $81.17. The current price is below the midline, which on a 1-hour basis is mildly bearish. The hourly ATR of $0.64 points to modest volatility. This is a coiling market, not an explosive one. The hourly pivot S1 at $80.45 is the first line of defense for bulls. Losing it on a closing basis would open a test of $79.88, the daily S1 level.
The 15-Minute Frame: Stabilizing, But Don’t Read Too Much Into It
The 15-minute chart is best used for entry timing rather than directional conviction. Price at $80.86 sits above the M15 EMA20 ($80.72) but below the EMA50 ($80.96) and EMA200 ($81.20). That creates a mixed stack, describing a market that has stabilized after recent weakness without recapturing control. The MACD histogram at +0.04 is barely positive, turning up from a negative cross. However, the RSI at 51.30 is flat neutral. There is no urgency from either side at this granularity.
The M15 Bollinger Bands create a tight execution corridor: upper at $81.08, lower at $80.20. For anyone looking to enter a long position, the zone between $80.45 and $80.68 offers the logical staging area. It combines the hourly S1 with the M15 pivot point. A clean hold and bounce from that zone, with the 15-minute RSI turning back above 55, would offer a reasonable entry signal. The target would be the $81.08 to $82.06 band.
Solana’s On-Chain Ecosystem: DeFi Fees Sending a Mixed Signal
DefiLlama data on Solana-native DEX activity presents an interesting mosaic. PumpSwap has seen a sharp 1-day fee decline of -27.66% but is up 38.59% over 7 days and 90.52% over 30 days. That suggests a volatile but structurally growing protocol. Raydium AMM, the ecosystem stalwart, is down across all three windows (-22.63% / -19.93% / -68.35%). This signals a meaningful drop in speculative meme-coin trading flow, which has historically correlated with SOL price spikes.
Orca DEX, by contrast, exploded 110.36% in a single day. That kind of volume anomaly can reflect either a large liquidity event or renewed institutional-style routing through the protocol. The overall DeFi picture for Solana right now is one of rotation rather than growth. Total activity has not collapsed, but its composition is shifting. That is neutral-to-cautious for price. The ecosystem remains alive but is not generating the raw speculative heat that drove prior rallies above $100.
Two Scenarios, One Decision
The bullish case hinges on the daily structure holding firm. If SOL maintains above $79.88 on a closing basis and recaptures the 1H EMA cluster around $81.05–$81.13, the path toward $82.06 opens. From there, the upper Bollinger Band at $83.66 becomes the target. A weekly close above $83.66 would signal this recovery has legs beyond a short-term bounce. The daily MACD momentum, if sustained, gives bulls the wind at their backs. However, a daily close below $76.42 would kill this thesis entirely.
The bearish case starts with the hourly distribution and the extreme fear environment. If price loses the $80.45 to $80.68 support band on an hourly basis, the slide toward $79.88 is almost mechanical. Below that, the $76.00 to $76.50 EMA cluster becomes the target. Given the daily ATR of $4.42, that move could unfold in a single volatile session.
Moreover, the 200-day EMA at $99.00 looms as a reminder that the broader trend has not turned. A failure here — especially if BTC dominance continues grinding higher — could mean the entire rally from the lows gets retraced. A strong daily close above $83.66 with expanding volume would kill the bear case.
Positioning Context
Solana at $80.86 demands patience more than urgency. The daily chart has done real work: the MACD cross is genuine, the EMA reclaim is genuine, and the price location in the upper Bollinger Band is constructive. However, the hourly softness and the extreme fear reading mean the risk of a shakeout before continuation is elevated. The daily ATR suggests moves of $4+ are routine, so stop placement needs to be honest. Tight stops around the current price will almost certainly get picked off.
The most coherent posture for someone already long is to treat $79.88 to $80.45 as a line in the sand. A decisive hourly close below it changes the short-term picture materially. For those on the sidelines, the $80.45 to $80.68 zone offers a cleaner risk/reward than chasing at current levels. In both cases, the looming overhead at $99.00 — the 200-day EMA — remains a ceiling that does not disappear just because the daily MACD is green. This market can be right directionally and still be frustratingly slow. Size accordingly.
FAQ
What is Solana’s price today and where is it trading relative to key EMAs?
Solana is trading at $80.86 as of early July 2026. On the daily timeframe, it holds above both the 20-day EMA at $75.88 and the 50-day EMA at $76.42. However, on the hourly chart, SOL has slipped below the 1H EMA20 ($81.05) and EMA50 ($81.13), signaling short-term weakness.
Is Solana’s daily chart showing bullish or bearish signals?
The daily chart presents a constructive picture. The MACD shows a clear bullish cross with an expanding histogram of 1.40, and the RSI at 61.88 sits in healthy bullish territory without being overbought. However, the 200-day EMA at $99.00 remains a significant overhead resistance, keeping the broader macro trend technically bearish.
What are the key support and resistance levels to watch for SOL?
Key support sits at the $80.45 to $80.68 zone on the hourly timeframe, with the daily S1 at $79.88 acting as the next line of defense. On the resistance side, $82.06 (daily R1) is the first hurdle, followed by the upper Bollinger Band at $83.66. A weekly close above $83.66 would signal a genuine breakout attempt.
Disclaimer: This article is for informational purposes only and does not constitute financial advice, an investment recommendation, or a solicitation to buy or sell any financial instrument or cryptocurrency. The analysis provided is not indicative of future results. Investing in crypto assets and financial markets carries a high risk of capital loss. Always do your own research (DYOR) and consult a qualified financial advisor before making any decision.
Article produced with the assistance of artificial intelligence and reviewed by the editorial team.
Source: Original Article