Thursday, June 25, 2026
Market News Board | Market Analysis,Charts & News
No Result
View All Result
  • Home
  • Market Overview
    • All
    • Crude Oil Prices
    • ETFs
    • Indices
    • Stock Market
    South Korea’s IPO bust clouds equity markets

    South Korea’s IPO bust clouds equity markets

    Bullish inventories meet bearish expectations

    Bullish inventories meet bearish expectations

    Newmont Corporation Stock (NEM) Closed Down by 4.17% on Jun 24: What Investors Need To Know

    Newmont Corporation Stock (NEM) Closed Down by 4.17% on Jun 24: What Investors Need To Know

    Hong Kong’s largest ETF is a leveraged bet on a single stock

    Hong Kong’s largest ETF is a leveraged bet on a single stock

    UBS offers trigger-call contingent yield notes linked to three indices

    Forbes Daily: Tech Selloff Fuels Stock Market Decline

    Forbes Daily: Tech Selloff Fuels Stock Market Decline

    • Economy News
    • Cryptocurrency News
    • Stock Market
    • Crude Oil Prices
    • ETFs
    • Indices
  • Forex Market
    • All
    • Central Banks News
    • Currencies
    • Fed Interest Rate Decision
    • Nonfarm Payroll
    Fed Interest Rate Decision June 2026: What the Hawkish Pause Means for Investors

    Fed Interest Rate Decision June 2026: What the Hawkish Pause Means for Investors

    Arkansas jobless rate at 4.2% in May, up from 4% in May 2025

    Arkansas jobless rate at 4.2% in May, up from 4% in May 2025

    British Pound recovers from two-month low as Iran deal hits USD

    British Pound Sterling’s turnaround is dead on arrival

    MUFG says intervention threat slowing yen slide as BOJ hike fails to shift USD/JPY trend

    MUFG says intervention threat slowing yen slide as BOJ hike fails to shift USD/JPY trend

    BIS Warns Current Stablecoins Threaten Global Financial Stability

    BIS Warns Current Stablecoins Threaten Global Financial Stability

    The Fed’s Latest Inflation Reading Has Good and Bad News for the Stock Market. Here’s What It Means for Investors.

    The Fed’s Latest Inflation Reading Has Good and Bad News for the Stock Market. Here’s What It Means for Investors.

    • Fed Interest Rate Decision
    • Nonfarm Payroll
    • Currencies
    • Central Banks News
  • Commodities
    • All
    • Gold
    • Oil and Gas
    • Silver
    Bullish inventories meet bearish expectations

    Bullish inventories meet bearish expectations

    Gold Price Forecast: XAU/USD nears $4,100 as Fed tightening bets rise

    Gold price breaks below $4,000 as US Dollar hits 13-month high

    CME to sue commodities regulator over perpetual futures, CEO Duffy tells CNBC — TradingView News

    LatAm FX hits two-week low as dollar strengthens, commodities pressure stocks — TradingView News

    Silver Futures Technical Analysis

    Silver Futures Technical Analysis

    The New Age of Exploration

    The New Age of Exploration

    Local Gold Prices Decline: 21-Karat Records 83.9 Dinars…

    Local Gold Prices Decline: 21-Karat Records 83.9 Dinars…

    • Silver
    • Gold
    • Oil and Gas
  • Crypto
    • All
    • Bitcoin
    • Ethereum
    • Litecoin
    • Ripple
    • Solana
    • XRP
    Why are the Crypto Market and Stock Prices Crashing?

    Why are the Crypto Market and Stock Prices Crashing?

    Bitcoin Price Craters To $59,000. The Worst Might Be Coming

    Bitcoin Price Craters To $59,000. The Worst Might Be Coming

    AAVE v4 deposits on Ethereum reach $200M, doubling in a month

    AAVE v4 deposits on Ethereum reach $200M, doubling in a month

    Lite Strategy leads $1 million investment in LitVM to build Litecoin Layer 2 network

    Litecoin (LTC) Could Rally Ahead of 2027 Halving, Historical Patterns Suggest

    XRP Price Crashes As Lending Platform Strobe Finance Shut Down

    XRP Price Crashes As Lending Platform Strobe Finance Shut Down

    Solana Forms Bearish Chart Pattern

    Solana Forms Bearish Chart Pattern

    • crypto-markets
    • Bitcoin
    • Ethereum
    • Litecoin
    • Ripple
    • XRP
    • Solana
  • Economic Calendar
  • Real Time Chart
Market News Board
No Result
View All Result
Home Commodities

Gold price breaks below $4,000 as US Dollar hits 13-month high

by Market News Board
4 hours ago
in Commodities, Gold
A A
Gold Price Forecast: XAU/USD nears $4,100 as Fed tightening bets rise


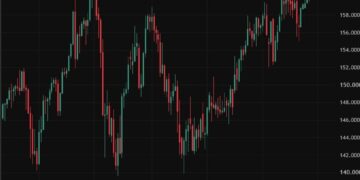
Gold (XAU/USD) price collapses by over 3% on Wednesday during the North American session amid broad US Dollar strength, despite US Treasury yields tumble on speculation that the reopening of the Strait of Hormuz could ease inflationary pressures. At At the time of writing, the XAU/USD pair trades at $3,986, falling below the $4,000 mark for the first time since November 2025.XAU/USD slides as Dollar strength overwhelms falling Treasury yieldsThe decline in Gold prices contrasts with the rise of the Greenback. The US Dollar Index (DXY), which tracks the buck’s performance against a basket of six currencies, hit a 13-month high of 101.80. At the time of writing, the DXY is up 0.19% to 101.56, despite the fall of US Treasury yields.The US 10-year T-note yield is down almost nine basis points to 4.410% due to falling Oil prices, sparked by the reopening of the Strait of Hormuz.West Texas Intermediate (WTI) US Oil is down 3.40% in the day to $70.55 per barrel, as negotiations between the US and Iran progressed, according to US Vice President JD Vance and Iran’s ambassador to the UN. However, traders should be aware of conflicting remarks from both sides regarding inspections of Tehran’s nuclear installations.The drop in Oil prices hasn’t tempered traders’ pricing in a hawkish Federal Reserve (Fed), as the US central bank showed division on the board: with eight of the 19 forecasting a rate hike toward the end of 2026, while the majority are set to hold rates.Prime Terminal data shows that the Fed is expected to keep interest rates unchanged at the next meeting, yet by a slim margin, with odds standing at 60% to hold and 40% for a rate hike.For December, the chances for an increase are 82%, with traders pricing in 20 basis points of tightening.Source: Prime TerminalAhead, the US economic docket will be busy. Traders’ focus shifts to the release of the Fed’s preferred inflation measure, the Core Personal Consumption Expenditures (PCE) Price Index, Gross Domestic Product (GDP) figures for the first quarter of 2026, Durable Goods Orders and jobless claims.XAU/USD technical outlook:Gold’s trend shifted downward after clearing the 200-day Simple Moving Average (SMA) at $4,473, exacerbating the decline and pushing it towards breaking the $4,000 level.Bearish momentum has increased since bullion retested $4,400. Buyers’ failure at that level sparked the sell-off.The Relative Strength Index (RSI) just pierced oversold territory, though it remains shy of testing the most extreme 20-level. Hence, further downside in XAU is seen as sellers gain momentum.If Gold drops below $3,950, the next support would be $3,900, ahead of the October 28, 2025 swing high of $3,886. Below this level, the next support is the April 22, 2025, daily high, which has turned into support at $3,500.On the flip side, buyers must reclaim $4,000 before clearing $4,098, the March 23 daily low, to remain hopeful of higher prices.Gold daily chart

Gold FAQs

Gold has played a key role in human’s history as it has been widely used as a store of value and medium of exchange. Currently, apart from its shine and usage for jewelry, the precious metal is widely seen as a safe-haven asset, meaning that it is considered a good investment during turbulent times. Gold is also widely seen as a hedge against inflation and against depreciating currencies as it doesn’t rely on any specific issuer or government.

Central banks are the biggest Gold holders. In their aim to support their currencies in turbulent times, central banks tend to diversify their reserves and buy Gold to improve the perceived strength of the economy and the currency. High Gold reserves can be a source of trust for a country’s solvency. Central banks added 1,136 tonnes of Gold worth around $70 billion to their reserves in 2022, according to data from the World Gold Council. This is the highest yearly purchase since records began. Central banks from emerging economies such as China, India and Turkey are quickly increasing their Gold reserves.

Gold has an inverse correlation with the US Dollar and US Treasuries, which are both major reserve and safe-haven assets. When the Dollar depreciates, Gold tends to rise, enabling investors and central banks to diversify their assets in turbulent times. Gold is also inversely correlated with risk assets. A rally in the stock market tends to weaken Gold price, while sell-offs in riskier markets tend to favor the precious metal.

The price can move due to a wide range of factors. Geopolitical instability or fears of a deep recession can quickly make Gold price escalate due to its safe-haven status. As a yield-less asset, Gold tends to rise with lower interest rates, while higher cost of money usually weighs down on the yellow metal. Still, most moves depend on how the US Dollar (USD) behaves as the asset is priced in dollars (XAU/USD). A strong Dollar tends to keep the price of Gold controlled, whereas a weaker Dollar is likely to push Gold prices up.


Source link

RelatedPosts

Bullish inventories meet bearish expectations

by Market News Board
June 24, 2026
Bullish inventories meet bearish expectations

(By Oil & Gas 360) – The oil market is entering a new phase of uncertainty. After months dominated by headlines surrounding the Iran conflict,...

Read moreDetails

LatAm FX hits two-week low as dollar strengthens, commodities pressure stocks — TradingView News

by Market News Board
June 24, 2026
CME to sue commodities regulator over perpetual futures, CEO Duffy tells CNBC — TradingView News

EnglishEnglishSelect market data provided by ICE Data Services. Select reference data provided by FactSet. Copyright © 2026 FactSet Research Systems Inc.Copyright © 2026, American Bankers...

Read moreDetails
rdfhdhhnd rdfhdhhnd rdfhdhhnd

dx

June 2026
M T W T F S S
1234567
891011121314
15161718192021
22232425262728
2930  
     
Market News Board Market Analysis Charts & News

© 2026 Market News Board - Market Analysis,Charts & News by Market News Board.

Navigate Site

  • About
  • Contact
  • Terms and Conditions
  • Privacy Policy
  • Disclaimer

Follow Us

Apple Inc.
$293.08
GBP/USD
$1.32
Amazon.com, Inc.
$234.27
Alphabet Inc.
$345.04
EUR/USD
$1.14
Tesla, Inc.
$375.53
Microsoft Corporation
$365.46
Dow Jones Industrial Average
$51,848.90
USD/JPY
$161.72
Micro Gold Futures,Aug-2026
$4,000.10
Bitcoin USD
$60,797.02
USD/CAD
$1.42
USD/CHF
$0.812
No Result
View All Result
  • Home
  • Market Overview
    • Economy News
    • Cryptocurrency News
    • Stock Market
    • Crude Oil Prices
    • ETFs
    • Indices
  • Forex Market
    • Fed Interest Rate Decision
    • Nonfarm Payroll
    • Currencies
    • Central Banks News
  • Commodities
    • Silver
    • Gold
    • Oil and Gas
  • Crypto
    • crypto-markets
    • Bitcoin
    • Ethereum
    • Litecoin
    • Ripple
    • XRP
    • Solana
  • Economic Calendar
  • Real Time Chart

© 2026 Market News Board - Market Analysis,Charts & News by Market News Board.

This website uses cookies. By continuing to use this website you are giving consent to cookies being used. Visit our Privacy and Cookie Policy.