Fundamental
Overview
The US dollar remains under
pressure as we got a few bearish catalysts this week. The first one came from Fed’s Bowman who delivered dovish comments and
even suggested that she would support a rate cut in July if inflationary
pressures were to remain muted. Since she’s been a hawkish member, the market
reacted strongly to such a development.
The second catalyst came later
in the same day as Iran delivered a symbolic
retaliation much
like the one witnessed in 2020 with Suleimani. The market then expected the end
of the conflict which was validated soon after by Trump’s post on his social
media platform.
Finally, yesterday we got
Trump lamenting again about the delay in rate cuts and WSJ
reported that the President was considering speeding up the announcement of
a new Fed Chair for next year. Month-end flows might also be responsible for
dollar weakness.
On the JPY side, nothing
has changed fundamentally, and the currency has been mainly driven by the risk
sentiment. As a reminder, the BoJ kept interest rates unchanged at 0.5% and
reduced the bond tapering plan for fiscal year 2026 as expected at the last
meeting. The BoJ continues to place a great deal on the US-Japan trade deal and
the evolution of inflation.
USDJPY
Technical Analysis – Daily Timeframe
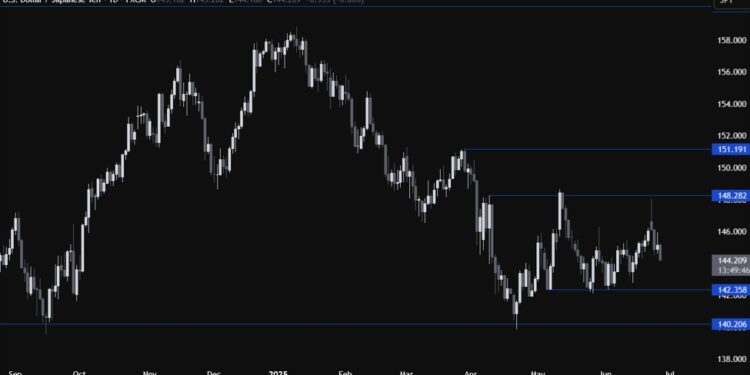
USDJPY Daily
On the daily chart, we can
see that USDJPY continues to roll over towards the bottom of the recent range
around the 142.35 level. That’s where we can expect the buyers to step in with
a defined risk below the level to position for another rally into the 148.28 resistance.
The sellers, on the other hand, will want to see the price breaking lower to
increase the bearish bets into the 140.00 handle next.
USDJPY Technical
Analysis – 4 hour Timeframe
USDJPY 4 hour
On the 4 hour chart, we can
see that as the price broke below the 146.28 level, the sellers piled in more
aggressively to target the 144.25 zone. The price is now breaking further below the 144.25 zone which should see the sellers increasing their bearish bets into the 142.35 support. If the price rises back above the zone, we can expect the buyers to step in to position for a rally back into the 146.28 level next.
USDJPY Technical
Analysis – 1 hour Timeframe
USDJPY 1 hour
On the 1 hour chart, we can
see we now have a downward trendline defining the bearish momentum on this
timeframe. If the price pulls back into the trendline,
we can expect the sellers to lean on it with a defined risk above it to
position for a break below the 144.25 zone with a better risk to reward setup.
The buyers, on the other hand, will look for a break higher to increase the bullish
bets into new highs. The red lines define the average daily range for today.
Upcoming
Catalysts
Today, we get the latest US Jobless Claims figures and the
Final US Q1 GDP report. Tomorrow, we conclude the week with the Tokyo CPI, the
US PCE price index and the Final University of Michigan Consumer Sentiment
report.
ForexLive.com
is evolving into
investingLive.com, a new destination for intelligent market updates and smarter
decision-making for investors and traders alike.


