


The major US stock indices are closing mixed with the Dow modestly higher, the S&P unchanged and the Nasdaq modestly lower.
A snapshot of the closing levels shows:
- Dow Industrial Average, +54.34 points or 0.13% at 42,270.07
- S&P down -0.48 points or -0.01% at 5911.69
- Nasdaq down -62.11 points or -0.22% at 19113.77
The Russell 2000 closed lower by -8.49 points or -0.41% at 2066.26
For the trading week, the indices all closed higher:
- Dow rose 1.60%
- S&P rose 1.88%
- Nasdaq rose 2.01%
- Russell 2000 rose 2.01%
It is also the month end, and the major indices all closed higher with the Nasdaq index rising over 9.5%
- Dow rose 3.94%
- S&P rose 6.15%
- Nasdaq rose 9.56%
- Russell 2000 rose 5.20%
Finally, for the first 5 months of the 2025 year:
- Dow is down -0.64%
- S&P is down -0.51%
- Nasdaq is down -1.02.
Although lower, major indices are well of the lows reached in early April.
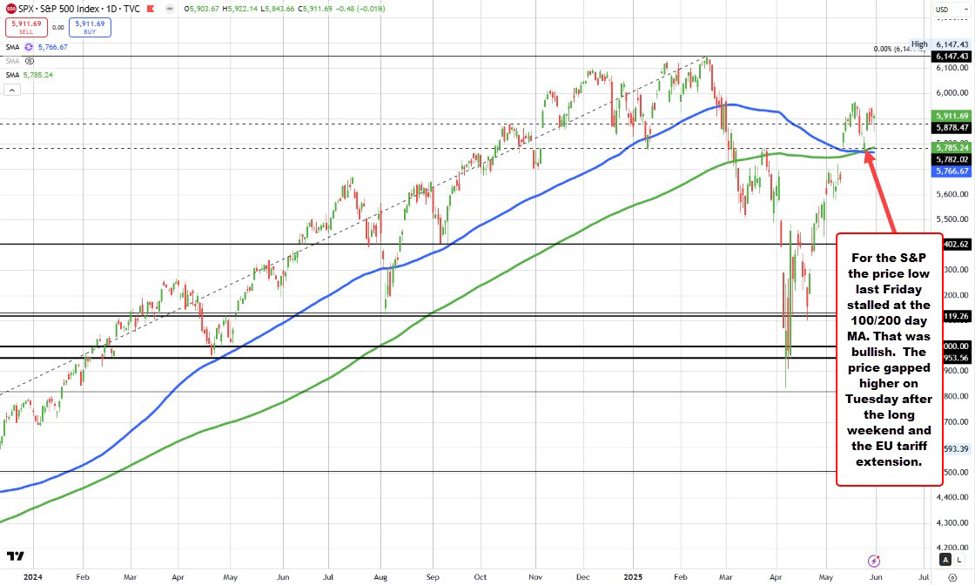
Technically, both the broader S&P and Nasdaq indices are closing the week on a strong note, holding above their 100- and 200-day moving averages, which were tested at last Friday’s session lows. The shortened holiday week began with a gap higher on Tuesday, driven by the news of an extension in EU tariffs, propelling the indices further away from those key MAs and reinforcing the bullish bias.
Looking ahead, the 100-day MA (5766.67) and 200-day MA (5785.24) will serve as important risk and bias-defining levels. As long as the S&P remains above these moving averages, the technical outlook will continue to favor the bulls.
For the Nasdaq index, price action has remained constructive since breaking above the 100- and 200-day moving averages on May 12. Last Friday, the decline found support at a key swing level near 18,598, which helped halt the pullback. The gap higher on Tuesday, following the EU tariff extension, pushed the index further from both the moving averages and that swing zone, reinforcing upside momentum.
Today’s session low came in at 18,847, brushing against another notable swing level at 18,831. Looking ahead to next week, close support is defined by the swing area between 18,598 and 18,811. Below that, the 200-day MA at 18,463 and the 100-day MA at 18,399 represent deeper support and key bias-defining levels. Holding above these zones keeps the bullish structure intact.
ForexLive.com
is evolving into
investingLive.com, a new destination for intelligent market updates and smarter
decision-making for investors and traders alike.


