


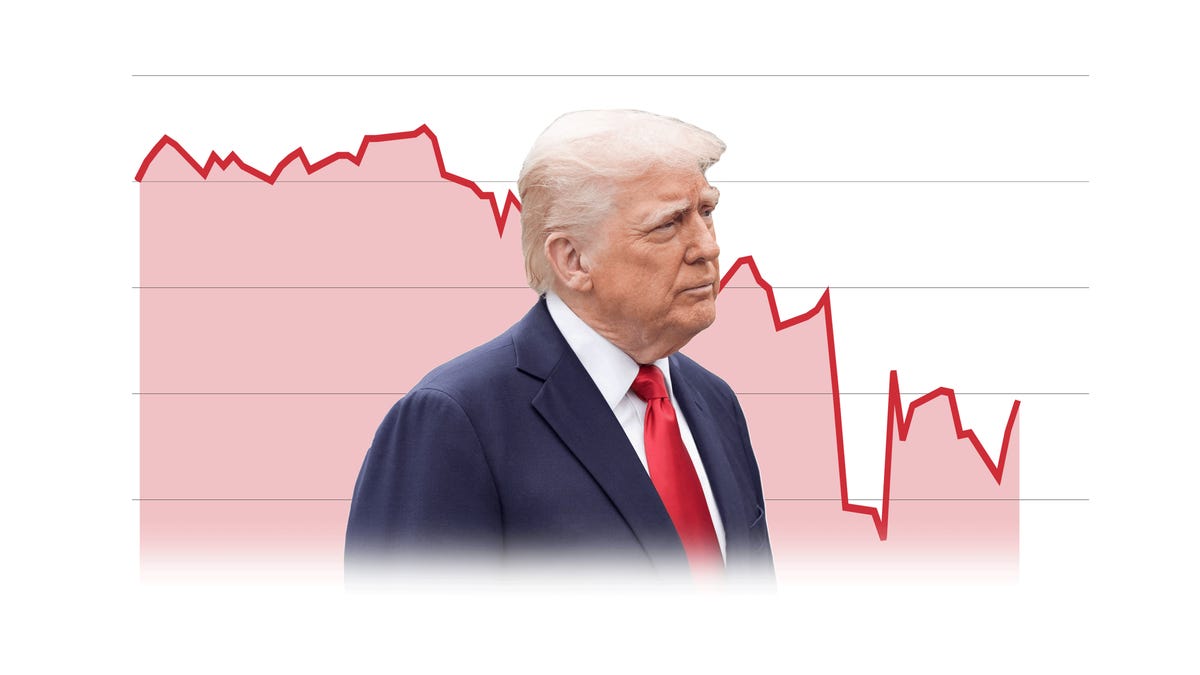
Analysis of the S&P 500, Dow Jones industrial average and Nasdaq during Donald Trump’s second term in office and how it compares to the first terms of Barack Obama and Joe Biden.
One hundred and one days into Donald Trump’s second presidency, investors aren’t as sure as they were about the short-term outlook for America’s businesses as they were when he took the oath of office.
In the weeks between Trump’s election and inauguration, the Dow Jones industrial average and the S&P 500 rose more than 4%, as investors expected more pro-business policies. Now, both indexes are more than 6% below where they stood on Election Day. The tech-heavy Nasdaq is down more than 11%.
After several days of volatility throughout April, all three major U.S. indexes narrowed the month’s declines or rose (Dow: -3%, S&P 500: -1%, Nasdaq: 1%) – even after a worse-than-expected GDP report on the month’s final day of trading.
The up arrows first turned down in February when Trump and his administration rolled out tariff plans for Mexico and Canada. Investor worries about the U.S. economy peaked in April when markets tumbled after the U.S. and China announced massive tariffs and Trump threatened to remove Federal Reserve chief Jerome Powell.
How the stock market has performed in Trump’s first 100 days
Unable to view our graphics? Click here to see them.
Heightened trade war could put U.S. on brink of recession
Trump has since assured investors that he won’t fire Powell, and he and others in the administration spent much of last week softening their tone toward China after rolling back tariffs on key tech products. Trump announced plans on April 29 to offer some tariff relief to automakers, allowing them to offset some of the taxes on parts for vehicles assembled in the U.S.
These first steps helped to calm the markets, but little else has officially changed in the U.S.-China trade war.
A note last week from Oxford Economics Senior Economist Matthew Martin stressed the importance of curbing the trade war: “Any further escalation would warrant adding a recession to our base forecast.”
Also, the most recent economic figures generally belie where businesses and economy stand. None – besides the first-quarter GDP estimate – have measured the initial impact of tariffs besides suggesting companies are prepping for them by building up their inventories.
“The trade deficit hit a new record in the first quarter as companies front-ran tariffs,” said Bill Adams, Comerica Bank chief economist in a note about Tuesday’s report. He predicted the high trade deficit would cut into GDP, which declined -0.3% in the first quarter, the Bureau of Economic Analysis announced Wednesday.
First-quarter GDP falls for first time in three years
One of the biggest economic questions rests on the 90-day pause for many of the tariffs Trump put in place in early April after the stock market tumbled and volatility jumped.
“Fear gauge” jumps to levels not seen since COVID-19 shutdowns
CBOE volatility index (VIX), nicknamed the “fear gauge,” measures how investors are hedging their bets on the markets. A higher number shows investors are protecting their investments against further declines in the market.
After hitting a high not seen since the early days of the COVID-19 pandemic, the gauge quickly settled back to less elevated levels – unlike previous shocks where the gauge remained elevated for months.
Of course, Trump is no stranger to erratic stock market movements during his presidency.
How the stock market performed in recent presidents’ first terms
In 2020 as COVID-19 led to shutdowns and layoffs, rattled investors drove down the Dow Jones industrial average by more than 25% in less than two weeks. The panic nearly erased all the gains of the previous three years of Trump’s administration. Yet by the end of his first term, the Dow had risen 55%.
That’s a story that’s been told frequently in the past couple of decades.
Barack Obama entered the White House in the midst of the Great Recession and watched share prices continue to sink before rising nearly 70% by the end of his first term. Joe Biden enjoyed a similar rebound after 40-year-high inflation receded.
Should you continue to buy and hold in your 401(k)?
Will the buy-and-hold investing technique pay off again for our 401(k)s, the way it has with previous shocks?
Only a few weeks ago, a two-day selloff wiped out $6.6 trillion dollars of market value on Wall Street. Since then, share prices and the major U.S. indexes have erased much of those declines. But, again, those indexes are also still well below where they were 100 days ago.
Perhaps, investors are saying “wait and see” to buying more securities as Trump and his administration have incrementally pared back U.S. tariffs, while remaining committed to reshaping global trade and bringing manufacturing and jobs back to the U.S.
In its April 11 bulletin, the Blackrock Investment Institute said “ongoing uncertainty is raising the risk of a recession,” but because of the markets’ swift response to tariffs in April the “U.S. administration is taking some account of financial risks and costs.”


