


Inside This Week’s Bull Bear Report
- Stock Market Performance As Summer Arrives
- How We Are Trading It
- Research Report – How Does Consumer Spending Impact Earnings
- YouTube – Before The Bell
- Market Statistics
- Stock Screens
- Portfolio Trades This Week
Breakout! Next Stop, Previous Highs
Last week, we discussed the successful test of the 200-DMA.
“Most notably, this past week was the successful test of the 200-DMA. The pullback to that previous broken resistance level and subsequent bounce highly suggests that the April correction is complete and that market control returns to the Bulls. As such, there is very little resistance between current levels and all-time highs. However, as noted last week, with the markets still overbought on a momentum basis, further consolidation will be unsurprising before an advance to new highs occurs. With the MACD sell signal triggered and money flows declining, another test of the 200-DMA next week would be unsurprising.”
Despite a weakening unemployment report, a spat between President Trump and Elon Musk, a resurgence in the Ukraine/Russia conflict, and remaining tariff uncertainty between China, Europe, and the U.S., the markets continued their bullish ways this past week. Notably, the market broke out of the ongoing consolidation process that has been in place since May 12th. The good news is that bullish breakouts confirm bullish momentum and suggest markets will trade higher into the next resistance level. That next resistance level is at 6100, the previous topping process before the March and April decline.
The market remains overbought short-term, but it is not uncommon for markets to stay overbought longer than most expect. While we patiently await a pullback to increase portfolio exposure, that could be a while longer before it occurs.
Critically, we are not looking for LOWER prices to add exposure. I am okay with paying higher prices. However, we are searching for a better risk/reward opportunity to add exposure. As such, a consolidation period that allows relative strength or momentum to cool off somewhat will provide a better buying opportunity than under current conditions. We already have sufficient exposure to the market to gain performance when markets rise, but deploying capital at these levels is more “risky” than I prefer.
While the probabilities are increasing that the market will potentially rally from here to 6100, there is an equal risk of disappointment. In other words, the risk/reward equals one, which is not a compelling “bet” for deploying capital. However, with some patience and the willingness to sacrifice some short-term performance, we will get an opportunity where the risk/reward proposition improves markedly. Those opportunities happen with regularity, just not when most expect them.
Let’s explore the seasonal stock market performance in June and the summer, and where the best opportunities may be found.
Need Help With Your Investing Strategy?
Are you looking for complete financial, insurance, and estate planning? Need a risk-managed portfolio management strategy to grow and protect your savings? Whatever your needs are, we are here to help.

June Stock Market Performance
After a powerful May, what does June’s stock market performance tend to look like? Historical data for the S&P 500 (since 1950) shows that June is typically a seasonally weak month—a key piece of the adage “Sell in May and go away.” That adage is a centuries-old market maxim rooted in the observation that stock market returns tend to be weaker during the summer months (May through October) compared to the “seasonally strong months” of November through April.

Since 1950, the S&P 500’s average returns from May through October have been considerably lower (about 1–2% total gain) than those from November through April (about 6–7% gain). This disparity is attributed to lower trading volumes, mid-year economic slowdowns, and investors taking summer vacations.
However, investors shouldn’t take “sell in May” as rigid investment advice. Modern market dynamics, global trading, and technological advancements have diluted some of its relevance. However, it serves as a reminder of seasonal market patterns and the importance of vigilance during traditionally sluggish months.
In this post, we analyze June stock market performance in context and examine summer investing trends across U.S. sectors, small and mid-cap stocks, international developed and emerging markets, and bonds. We will highlight which industries or asset classes fare better during the traditionally slow summer months (June–August), particularly when economic growth is slowing. The goal is to glean actionable insights for investors navigating the summer with an eye on a potential economic weakness.
Historical June Performance After a Strong May
Historically, June has been one of the weakest months for U.S. equities. Since 1950, the S&P 500’s average June stock market performance is roughly flat – about 0.1% gain on average (and a similar 0.1% median gain), with just over half of all Junes finishing positive. June ranks as the second-weakest month for the market (only September has been worse), with an average June return of only about 0.06% since 1957. This tepid performance helps explain the saying “sell in May,” as the early summer often brought lackluster returns.

However, recent decades have shown that June isn’t always a loser. The S&P 500 rose in 12 of the past 20 June months (and 8 of the past 10), though the gains in those positive Junes were usually modest. Seasonality is a tendency, not an ironclad rule. One crucial factor is whether May’s performance was strong. A big rally in May can signal momentum carrying into June. Historically, after the S&P 500 gains 5% or more in May, June has been positive five out of six times, averaging about a +1.2% return – a nice improvement over the typical ~0%. (By comparison, the average June, including all years, is around +0.7% in that study.)
In other words, a surge in May often bodes well for June, bucking the usual summer weakness. Recent analysis confirms this: when May rallies over 5%, the following June has an ~83% win rate and a higher median return, as noted, of 1.2%. However, as pointed out in this week’s Daily Market Commentary:
“As we enter June, share buybacks are beginning to slow. As shown, there is a very high correlation between share buybacks and the direction of the market, given that buybacks add an additional buyer to the market. With companies going into “blackout” in the middle of June, that “buyer” will evaporate from the market before the beginning of the Q2 earnings season. Does this mean the market will crash? No. However, it suggests that any weakness in the market, given the current overbought conditions, could be amplified until buybacks return in late July.”

Navigating During Periods Of Uncertainty
While seasonality is just one factor, market performance in any given summer can deviate due to economic and geopolitical developments. There have been notable summer rallies (for instance, in 2020 and 2021) where we saw substantial gains in the summer months. Conversely, the summers of 2023 (a 10% decline) and the summer of 2024 (an 8% decline) were impacted by concerns over “Mag 7” and the “Japanese Carry Trade,” respectively. However, while late July and August of 2024 were weak, May and June were two of the strongest months of that year, defying the usual pattern. Thus, while the summer months are seasonally weak on average, investors should use this historical data rather than a market-timing gospel for investing processes.
Most importantly, while the “selling in May” analysis and completely cashing out of the market until October sounds logical, we highly advise against such extreme moves. The reason is that there are a multitude of issues that accompany such extremes.
- Unpredictability: Markets are influenced by countless variables (economic data, geopolitical events, sentiment), making accurate predictions nearly impossible, even for experts.
- Missed Opportunities: Sitting out can mean missing significant rallies during summer months.
- Emotional Bias: Decisions to go all in or out are often driven by fear or greed, leading to buying high and selling low, the opposite of sound investing.
- Transaction Costs: Frequent moves increase fees and taxes, eroding returns.
- Long-Term Trends: Stock market performance tends to be positive far more often (shown above), which suggests remaining invested. That does not mean investors should disregard managing risk.
Stock Market Performance: Market Sectors During Summer Months
Instead of avoiding the market entirely, investors should use tactics to manage risk during more volatile, lower-return periods.
- Cash: Holding higher cash levels during the summer can reduce the impact of volatility on portfolios.
- Rotation: Rotating into more defensive positions or asset classes during summer is one strategy to cope with seasonality.
- Hedge: Investors can use simplistic options strategies or inverse ETFs to provide downside protection.
The latest ADP report suggests that the economy is slowing. When the economy slows, the stock market’s sector leadership often shifts.
Therefore, if we assume a slower-growth economy, defensive sectors, industries that provide essential goods or services, tend to be less sensitive to economic cycles. Historically, the best sectors during economic slowdown phases have been utilities, healthcare, and consumer staples. These companies can maintain stable revenues even when consumers or businesses tighten their belts. For example, people still need electricity, medication, and household basics in a downturn, so these sectors have inelastic demand and often outperform the broader market when growth is scarce. Furthermore, the case of utilities is building due to the increased demand for power generation from AI.
Conversely, cyclical sectors like technology, industrials, financials, and consumer discretionary tend to be more volatile during a slowdown. Their fortunes are more tied to economic growth. Therefore, a cooling economy can hurt earnings and stock performance. However, it’s not a one-size-fits-all story. Within cyclicals, some high-beta industries could defy traditional summer weakness as the “AI development” continues. Semiconductor and AI-related stocks could likely outperform. That may seem counterintuitive (since one might expect risk-off behavior in summer). Still, it suggests that stock-specific drivers (new product cycles, R&D breakthroughs, etc.) can trump seasonality for these industries.
What about Small and Mid-Caps?
Small & Mid Caps
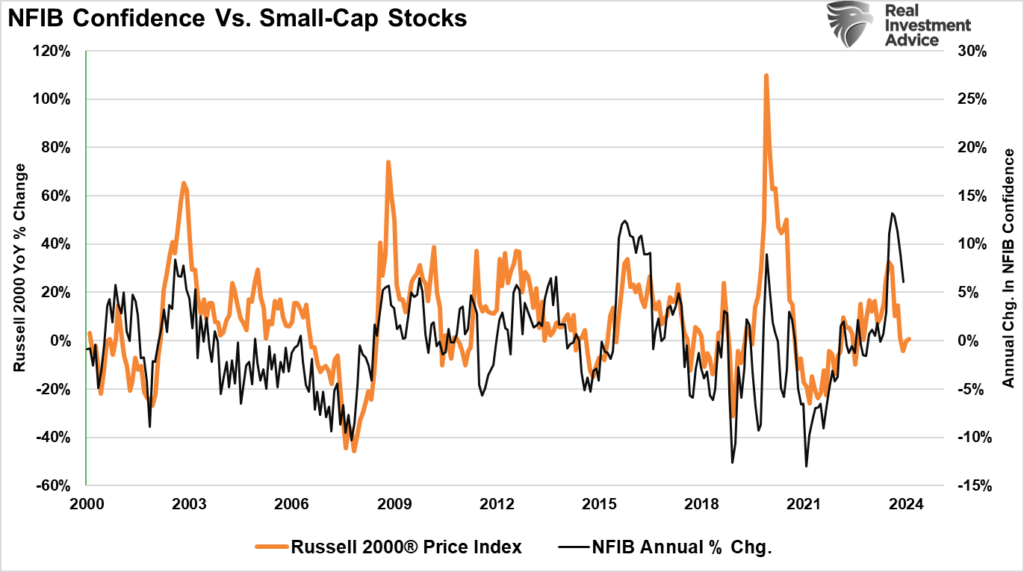
Historically, small-cap and mid-cap stocks (think Russell 2000 and S&P 400 indices) face headwinds during summer. It’s common to see small and mid-caps underperform large-caps during the late-cycle or pre-recession phase and economic slowdowns, as we are seeing now. This is because they are more sensitive to economic changes when it comes to earnings. For example, the correlation between the NFIB small business confidence index and the Russell 2000 is high. Given the sensitivity of small and mid-cap companies’ earnings to economic activity, this makes sense.
Another concern with small and mid-cap companies, particularly in an environment of elevated interest rates, is profitability. Given that 42% of small-cap and 14% of mid-cap companies already have negative earnings, an economic slowdown will likely have a much larger negative impact.

However, the good news is that coming out of past recessions (since 1930), U.S. small-cap stocks have outpaced large-caps, averaging about a 40% gain in the 6 months after a recession, versus roughly 25% for large-cap stocks. In other words, while small caps might be laggards during the slowdown, they often become leaders in the recovery. So, investors may consider being underweight small and mid-caps during a slowing economic environment, but keep them on the radar to add exposure if economic growth improves.
International Stocks
The seasonal trends are broadly similar for international markets. Developed market equities (e.g., Europe, Japan—often tracked by the MSCI EAFE index) also exhibit the “summer doldrums” to some degree, as many global investors reduce risk during June–August. Notably, the “Sell in May” proverb is said to have originated in London financial circles, indicating that Europe has a similar history of weak summer performance.
Furthermore, when U.S. growth slows, International developed markets often face slowdown pressures as well (Europe, for instance, is highly sensitive to global trade and U.S. demand). That said, different market sectors can cause variations. For example, European indexes have heavier weights in Financials and Energy, which could underperform in a slowdown, but also some defensive multinational consumer companies that might hold up.
Emerging markets (EM) are a more complex story. EM equities are generally considered riskier and tend to underperform when global risk appetite declines, which often coincides with the summer months if there’s economic uncertainty. A slowing U.S. economy can hurt emerging markets via reduced export demand and lower commodity prices (impacting EM commodity exporters). Additionally, if investors become more risk-averse, capital can flow out of emerging markets, pressuring their stocks and currencies. Indeed, summer has seen its share of EM sell-offs in years past (e.g. the 2015 China scare in August, or the 2018 EM currency wobble).
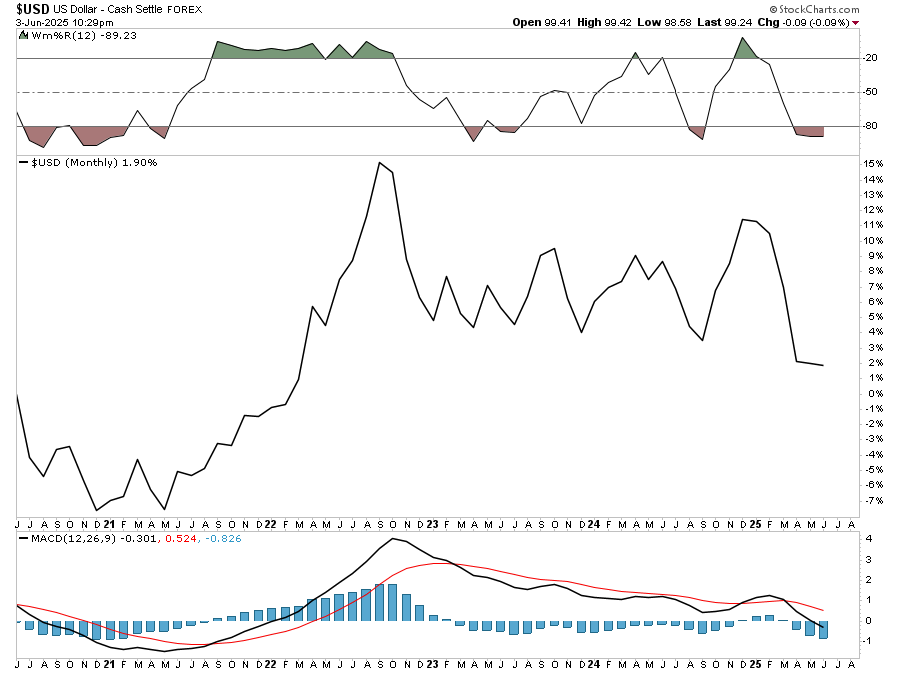
The one thing to watch concerning International and Emerging stock market performance is the value of the U.S. Dollar. There is an inverse correlation between international and emerging market stocks and the dollar. This is because foreign countries store excess reserves in US dollars, so when the dollar value decreases, they repatriate these dollars (extract them from US markets) and vice versa.

With the dollar deeply oversold on multiple levels, investors should expect a drag on foreign stock market performance if the dollar strengthens, which is becoming a reasonable outlook.
We can’t forget about bonds?
Bonds
Finally, bonds deserve attention as part of a summer slow-growth strategy. Unlike equities, bonds often thrive when economic growth slows. If inflation is in check and growth decelerates, interest rates tend to fall, which boosts bond prices (particularly high-quality bonds like U.S. Treasuries). Historically, incorporating bonds during May to October has improved risk-adjusted returns. The Stock Trader’s Almanac famously noted that an investor who moved out of stocks into fixed-income during the summer months and back into stocks in winter would have done well over the decades. While we don’t recommend doing a complete flip-flop in allocations, bonds act as a defensive ballast during past summer slumps..
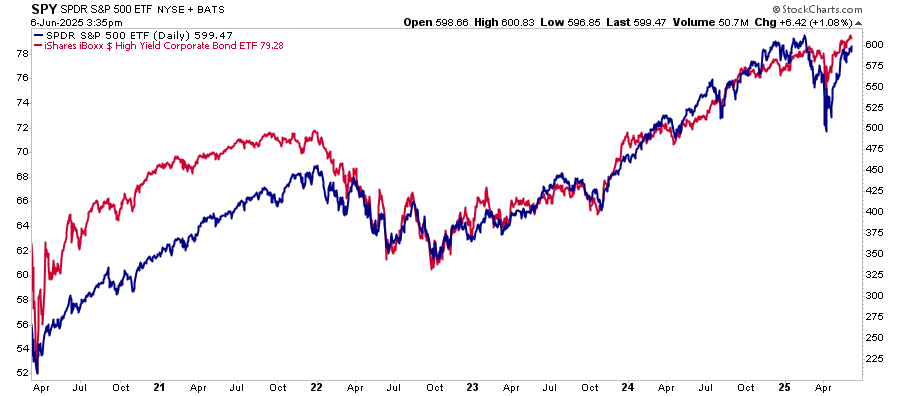
While Treasury bonds are a haven, cushioning portfolio losses, investment-grade corporate and municipal bonds tend to hold value better than stocks in these environments. Conversely, high-yield bonds (junk bonds) correlate more with equities due to the perceived risk to the underlying issuer. However, it is worth noting that junk bonds tend to outperform stocks (by not going down as much, in most cases) if the slowdown isn’t too severe, thanks to their interest payments.
The bottom line is that bonds provide diversification and stability during seasonally weak summers, a point reinforced by the historical strategy of adding bonds from May to October. In 2023–2025, for instance, bonds became more attractive after a rough 2022, offering yields that could finally compete with stocks; a slowing economy could further boost bond appeal in summer 2025 as investors anticipate potential Fed rate cuts.
Actionable Insights To Improve Stock Market Performance
In light of the historical trends and the current backdrop of slowing growth, here are some actionable insights for investors navigating the summer months:
- Stay Diversified, Don’t Try To Time It: Maintain a balanced portfolio rather than completely exiting the market in May. History shows that while summer returns are weaker on average, about half the time the market still rises. For example, recent June months have been positive more often than not. So, being out of the market could mean missed opportunities. A mix of asset classes (stocks, bonds, possibly cash) can help manage risk without abandoning upside potential.
- Tilt Toward Defensive Sectors: In an economic slowdown, consider overweighting defensive sectors like consumer staples, healthcare, and utilities. These sectors have historically outperformed during recessions or slow-growth periods. They may provide relative strength if the summer turns choppy. High-quality dividend stocks or defensive equity ETFs could buffer your portfolio against volatility.
- Use Bonds and Cash for Stability: Given seasonal weakness and slowdown risks, it’s prudent to have some allocation to fixed-income. High-quality bonds (Treasuries or investment-grade corporates) can serve as a safety net as they tend to rise when stocks fall, and have indeed been a winning summer strategy in the past If you are particularly cautious about the summer outlook, holding a bit of extra cash or short-term Treasury funds can give you dry powder and reduce portfolio swings.
- Think Long Term – Prepare for the Rebound: If markets pull back in the summer months, view it as an opportunity. Weak summers are often followed by year-end or post-recession rebounds. Historically, stocks rebound after drawdowns, which reminds us that what lags in a slowdown can lead during a recovery. Thus, investors with a longer horizon might nibble at beaten-down sectors during summer lulls, positioning for an eventual bounce. In other words, use summer to rebalance – trim any high-flyers and add to quality assets that become undervalued.
- Monitor Economic and Fed Signals: Remember that seasonal patterns take a back seat to real-world developments. Stay alert to economic data (growth, inflation) and Federal Reserve policy updates over the summer. If data shows further slowing, that could reinforce the case for defensives and bonds. Conversely, any signs of re-acceleration or stimulus (e.g. rate cuts) could spark a risk-on rally even during the “weak” summer months. Be ready to adjust your strategy if conditions change.
Investors can make informed allocation decisions by analyzing historical summer stock market performance in context and understanding summer investing trends. Summer 2025 may be influenced by slowing growth, but with a diversified and proactive approach, you can navigate the seasonal softness and find opportunities amid the doldrums. As always, focus on your long-term goals and risk tolerance.
Most importantly, seasonal patterns are helpful guides, but not absolute certainties. However, a solid investment plan transcends any single month or season.
How We Are Trading It
Regarding the summer stock market performance analysis above, we are positioned for what may come. Our portfolio is currently overweight cash (a hedge) and underweight, but allocated to fixed income. Equities are tilted toward defensive sectors but still have exposure to growth areas related to artificial intelligence.

We will use any summer weakness to buy quality companies on dips. Furthermore, we will watch the Federal Reserve closely for clues to monetary policy changes as the economy slows.
As we noted last week, successful investing is not about beating some arbitrary “index.” It is about managing risk, preserving capital, and steadily compounding returns toward your goals. Many “bearish” headlines make it seem logical that significant losses are in store for investors. However, most of those headlines are clickbait and are not founded on economic realities. We suggest you continue to ignore the noise, stay disciplined, and remember: no one hands out prizes for reckless investing—only consequences.
Continue to follow the rules and stick to your discipline. (Read our article on “What Is Risk” for a complete list of rules)
Feel free to reach out if you want to navigate these uncertain waters with expert guidance. Our team specializes in helping clients make informed decisions in today’s volatile markets.
Research Report

Subscribe To “Before The Bell” For Daily Trading Updates
We have set up a separate channel JUST for our short daily market updates. Please subscribe to THIS CHANNEL to receive daily notifications before the market opens.
Click Here And Then Click The SUBSCRIBE Button
Subscribe To Our YouTube Channel To Get Notified Of All Our Videos
Bull Bear Report Market Statistics & Screens

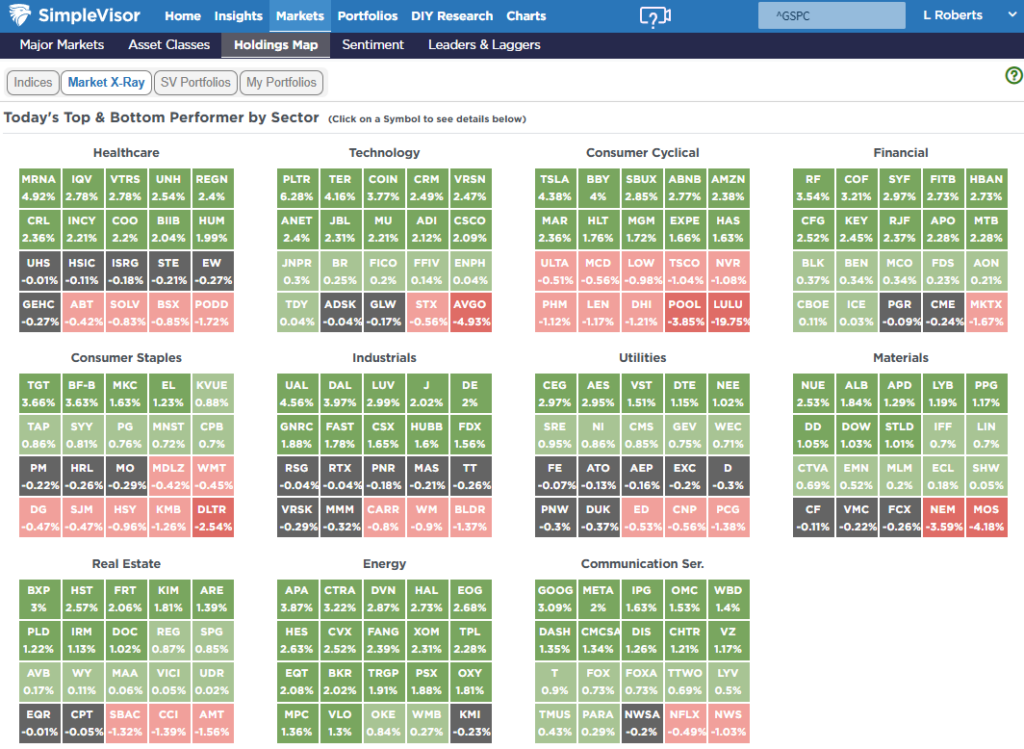
SimpleVisor Top & Bottom Performers By Sector
S&P 500 Weekly Tear Sheet

Relative Performance Analysis
This past week, the market finally broke out of its consolidation range that began on May 12th. Unfortunately, that consolidation did little to reverse the more overbought conditions in the markets, particularly in international and emerging market stocks, which are now extremely overbought. Such has been primarily a function of the dollar decline, which is likely near its conclusion. Investors should take profits and rebalance allocations back toward domestic equities, which will have a tailwind from the dollar appreciation. On a sector basis, industrials, technology, discretionary, mid-cap, small-cap, and communications are overbought, and profits should be harvested.

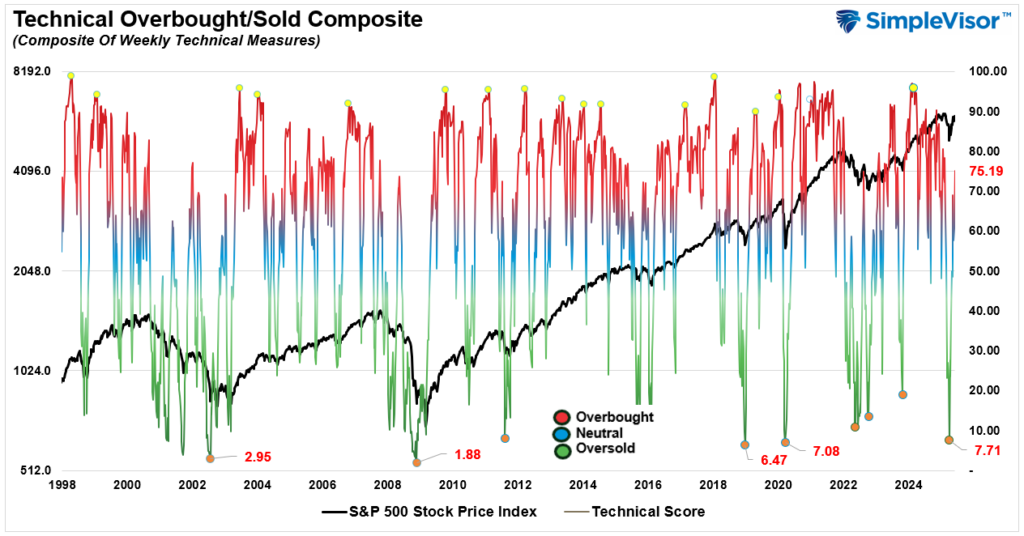
Technical Composite
The technical overbought/sold gauge comprises several price indicators (R.S.I., Williams %R, etc.), measured using “weekly” closing price data. Readings above “80” are considered overbought, and below “20” are oversold. The market peaks when those readings are 80 or above, suggesting prudent profit-taking and risk management. The best buying opportunities exist when those readings are 20 or below.
The current reading is 75.19 out of a possible 100.
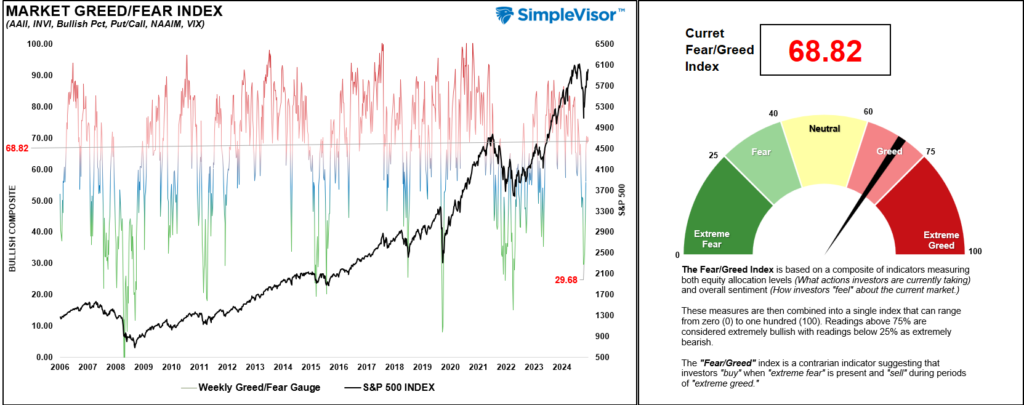
Portfolio Positioning “Fear / Greed” Gauge
The “Fear/Greed” gauge is how individual and professional investors are “positioning” themselves in the market based on their equity exposure. From a contrarian position, the higher the allocation to equities, the more likely the market is to be closer to a correction than not. The gauge uses weekly closing data.
NOTE: The Fear/Greed Index measures risk from 0 to 100. It is a rarity that it reaches levels above 90.
The current reading is 68.82 out of a possible 100.
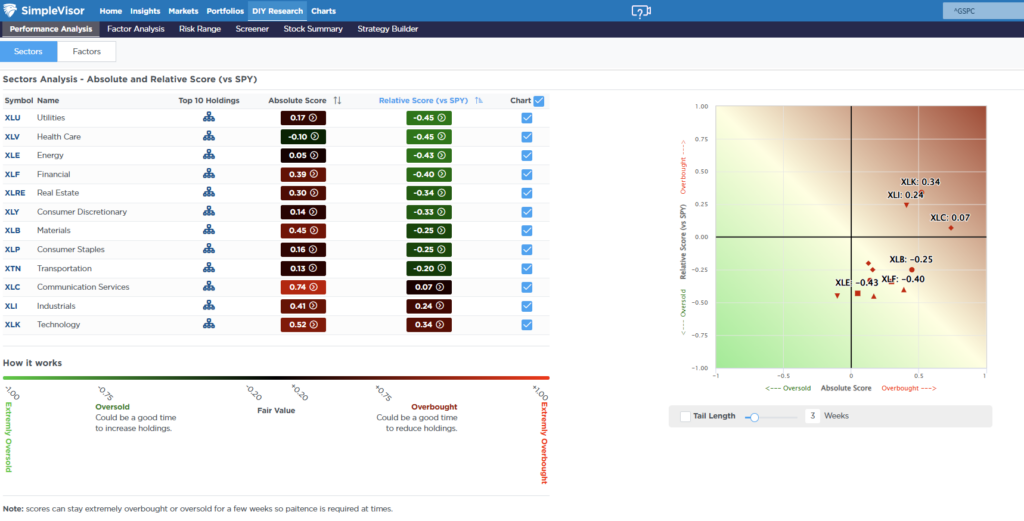
Relative Sector Analysis
Most Oversold Sector Analysis

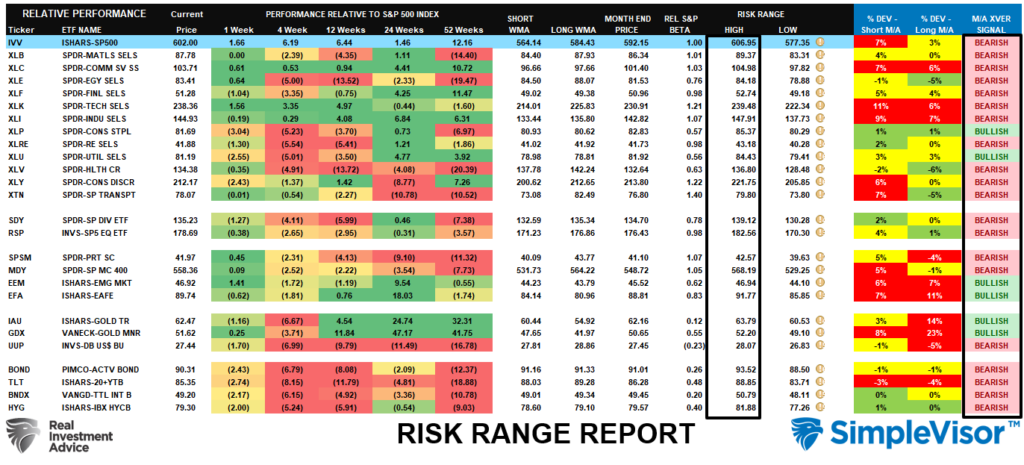
Sector Model Analysis & Risk Ranges
How To Read This Table
- The table compares the relative performance of each sector and market to the S&P 500 index.
- “MA XVER” (Moving Average Crossover) is determined by the short-term weekly moving average crossing positively or negatively with the long-term weekly moving average.
- The risk range is a function of the month-end closing price and the “beta” of the sector or market. (Ranges reset on the 1st of each month)
- The table shows the price deviation above and below the weekly moving averages.
While the market broke out of its consolidation range this past week, many sectors remain above normal risk ranges. We remain concerned about most markets and sectors being on bearish weekly signals. Such is historically only seen during more protracted corrections and bear markets, which suggests there may be risk to this bull market rally in the near term. Continue to trade cautiously and hold higher-than-normal levels of cash.
Weekly SimpleVisor Stock Screens
We provide three stock screens each week from SimpleVisor.
This week, we are searching for the Top 20:
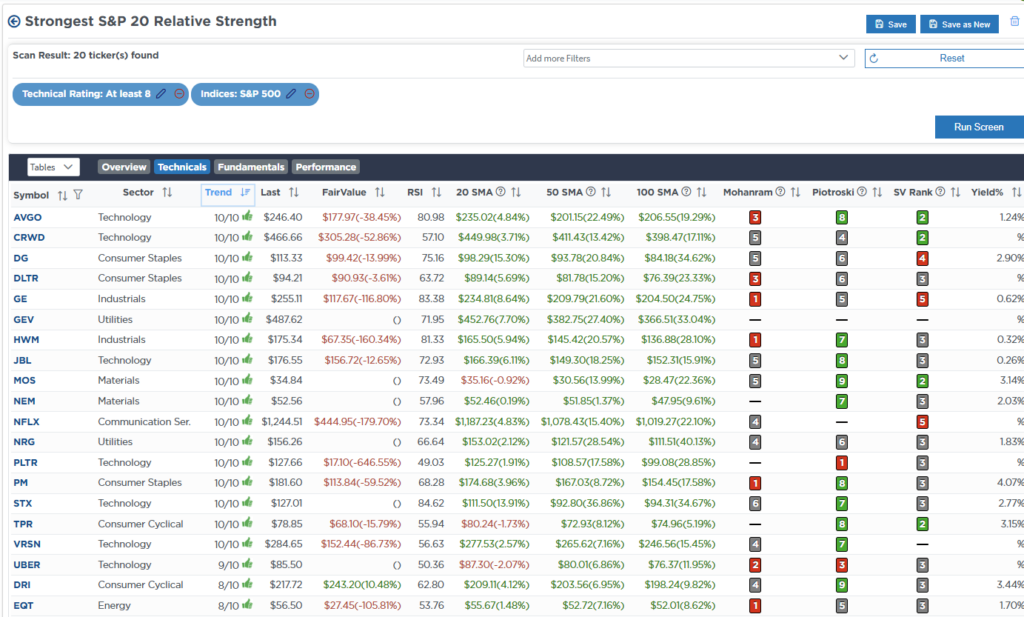
- Relative Strength Stocks
- Momentum Stocks
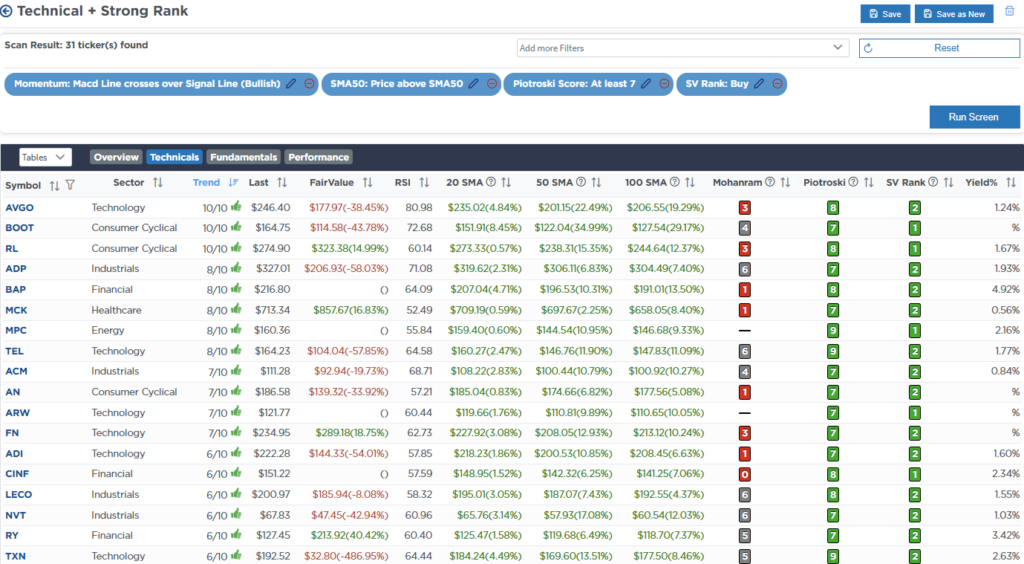
- Technical Strength W/ Dividends
(Click Images To Enlarge)
RSI Screen
Momentum Screen

Technically Strong With Dividends
SimpleVisor Portfolio Changes
We post all of our portfolio changes as they occur at SimpleVisor:
No Trades This Week
Lance Roberts, C.I.O., RIA Advisors


