


Fundamental
Overview
The S&P 500 is
approaching the all-time highs supported by two recent catalysts. The first one
came from Fed’s Bowman who delivered dovish comments and
even suggested that she would support a rate cut in July if inflationary
pressures were to be muted. Since she’s been a hawkish member until yesterday, it
was meaningful for the market.
The second catalyst came
late in the US session as Iran’s retaliation was seen as just a show much like
the one witnessed in 2020 with Suleimani. The market started to expect the end
of the conflict which was then validated by Trump’s post on his social media
platform.
In the big picture, the path
of least resistance remains to the upside as growth expectations continue to
improve. We now have very little risks ahead. The only one I can see as of now
is Trump’s bill failing in the Senate. The trade war shouldn’t be a risk
anymore as the deadline will be extended if needed and it’s now clear to
everyone that we will settle around 10% tariff rate.
The positive drivers
continue to be expansionary fiscal policy and the dovish Fed reaction function.
The main driver of the stock market is growth expectations, so as long as those
remain skewed to the upside, we should keep grinding higher.
S&P 500
Technical Analysis – Daily Timeframe
S&P 500 Daily
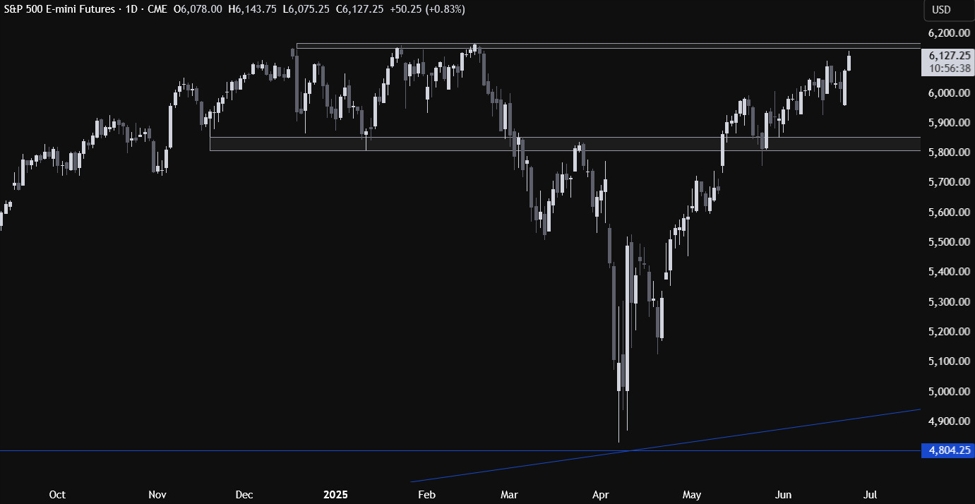
On the daily chart, we can
see that the S&P 500 is approaching the all-time high following the dovish
Fed’s Bowman comments and the Israel-Iran de-escalation. This is where we can
expect the sellers to step in with a defined risk above the all-time high to
position for a drop back into the 5,800 support
zone. The buyers, on the other hand, will look for a break higher to increase
the bullish bets into new highs.
S&P 500 Technical
Analysis – 4 hour Timeframe
S&P 500 4 hour
On the 4 hour chart, we can
see that the price has been trading inside a rising channel for the entire
month. Right now, we are close not only to the all-time highs but also to the
upper bound of the channel.
This might turn out to be a
strong resistance to break on the first try and the sellers will have more
conviction to step in around these levels with a protected stop above the
channel. The buyers, on the other hand, will look for a breakout to invalidate
the bearish setup and increase the bullish momentum.
S&P 500 Technical
Analysis – 1 hour Timeframe
S&P 500 1 hour
On the 1 hour chart, there’s
not much else we can add here but on a short term basis, if we get a break
below the 6,110 level, we could see the sellers extending the pullback into the
6,071 level next, where a further break to the downside would likely take us
back to the lower bound of the channel. The buyers, on the other hand, will
look for dip-buying opportunities around those levels as the fundamental trend
remains to the upside. The red lines define the average daily range for today.
Upcoming
Catalysts
Today, we have the US Consumer Confidence report and Fed
Chair Powell Testimony. On Thursday, we get the latest US Jobless Claims
figures and the Final US Q1 GDP report. On Friday, we conclude the week with
the US PCE price index and the Final University of Michigan Consumer Sentiment
report.
ForexLive.com
is evolving into
investingLive.com, a new destination for intelligent market updates and smarter
decision-making for investors and traders alike.


