


- Solana remains bullish but struggles to break the 100-day EMA resistance and extend the uptrend above $150.
- Solana staking volume surpasses that of Ethereum, but the ETH protocol has an edge in optimizing decentralization and infrastructure.
- SOL could extend gains beyond $160 following a falling wedge pattern breakout.
Solana (SOL) is trading at $148 during the European session on Friday, down slightly on the day, even as the crypto market extends a sigh of relief on the promise of potentially easing trade tensions between the United States (US) and China.
According to China’s Commerce Ministry, “the US has proactively reached out to China through multiple channels, hoping to hold discussions on the tariff issue,” Reuters reports. Although the exact timing of a tariff truce between China and the US remains unknown, sentiment across the crypto market has remained largely bullish.
Solana staking surpasses Ethereum and security implications
The Solana protocol on April 21 surpassed the Ethereum network in total staked value of their respective native tokens, SOL and ETH, reaching approximately $53.96 billion compared to the latter’s $53.77 billion. This has sparked discussions about the impact of staking on both networks.
Staking stats by crypto network | Source: Staking Rewards
In an article published on Wu Blockchain’s Substack, @Ox_Todd said that, considering the basics of Proof of Stake (Pos) mechanisms, “attacking ETH is significantly harder than attacking Solana.” This observation assumes that if the success rate of attacking Solana is 0.001%, the difficulty of attacking Ethereum could be 0.0001%.
“The reason is that ETH, as an ancient blockchain, has truly experienced PoS attacks from the early days. It has made extensive preparations to prevent this potential risk, such as encouraging retail investors to participate in staking,” the article states.
Nevertheless, the increase in Solana’s staking value to nearly par with that of Ethereum underscores the growing investor interest in SOL. This continues to propel the SOL-ETH ratio, which holds at 0.081, up from its lowest point of 0.0071 in June 2023.
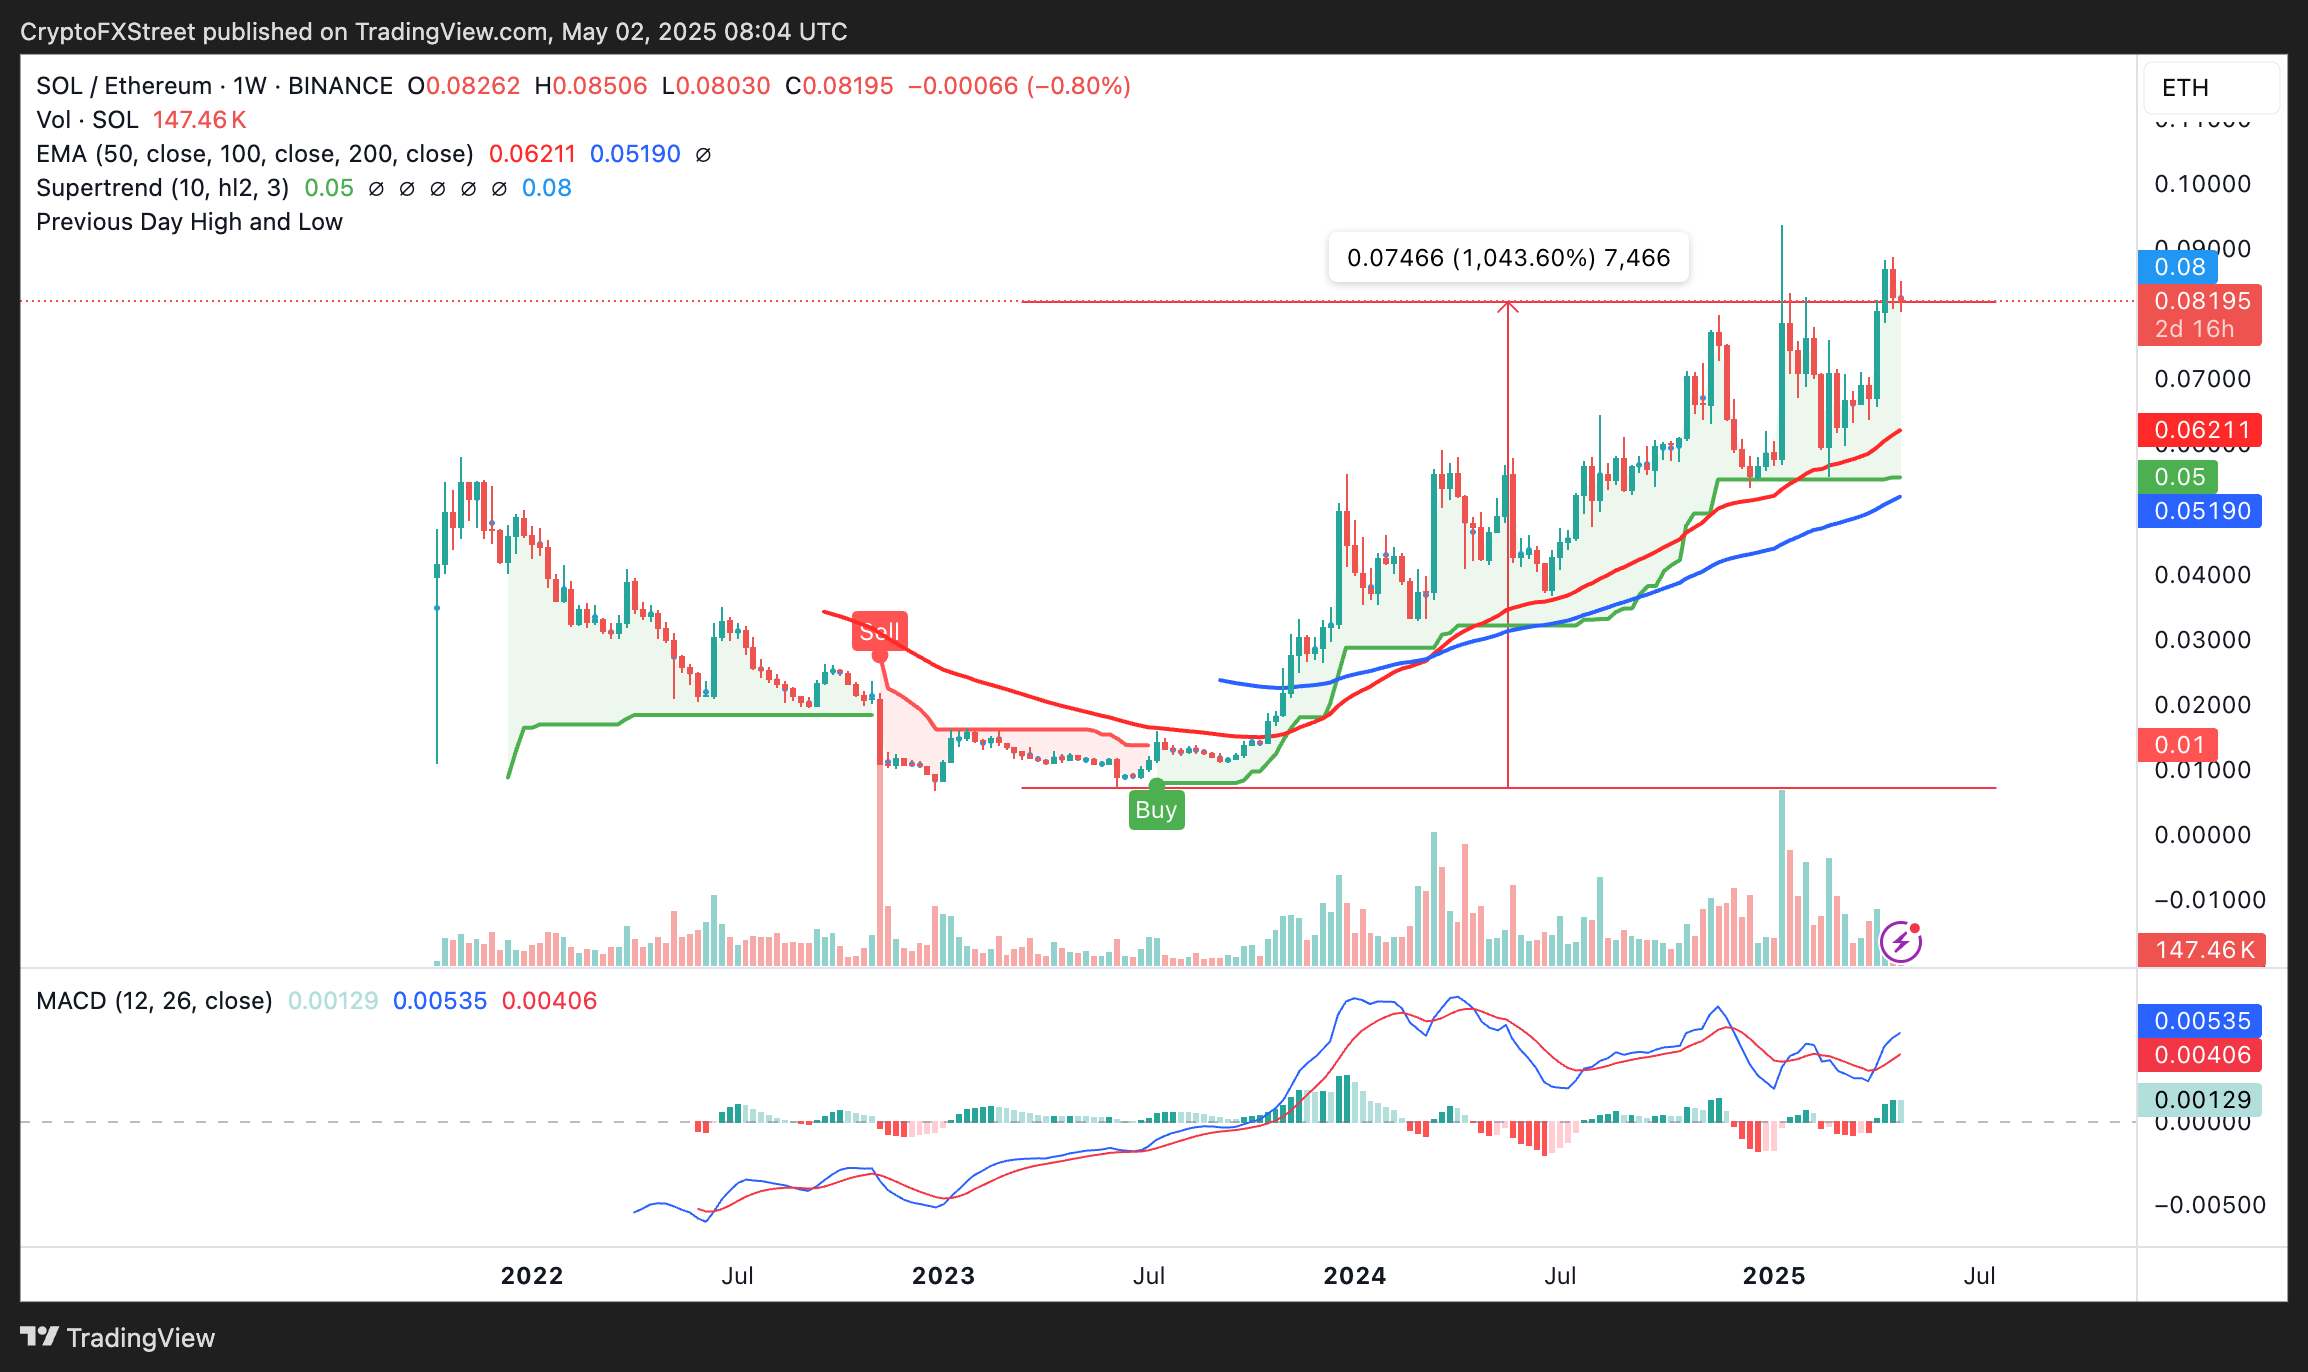
SOL-ETH ratio chart
The increase in Solana staking value risks destabilizing the network’s decentralized finance (DeFi) ecosystem. With staked SOL accounting for 65% of the supply, fewer tokens are dedicated to DeFi activities, such as liquidity provision in automated market makers (AMM) and lending protocols. Holders prefer staking SOL for rewards, which stands at 8.8% compared to the 3% staking rewards on Ethereum.
Solana’s uptrend hinges on reclaiming the 100-day EMA
Solana’s bullish outlook holds between two critical levels: the 50-day Exponential Moving Average (EMA) support at $140 and the 100-day EMA resistance at $150. A break above this resistance would clear the path for more gains that could complete a 40% falling wedge pattern’s breakout target to $161, coinciding with the 200-day EMA.
A buy signal presented by the SuperTrend indicator reveals that bulls could have the upper hand, especially if they break above the 100-day EMA. This signal, encouraging traders to buy SOL, occurs when the indicator flips below the price, changing color from red to green, as illustrated on the chart.
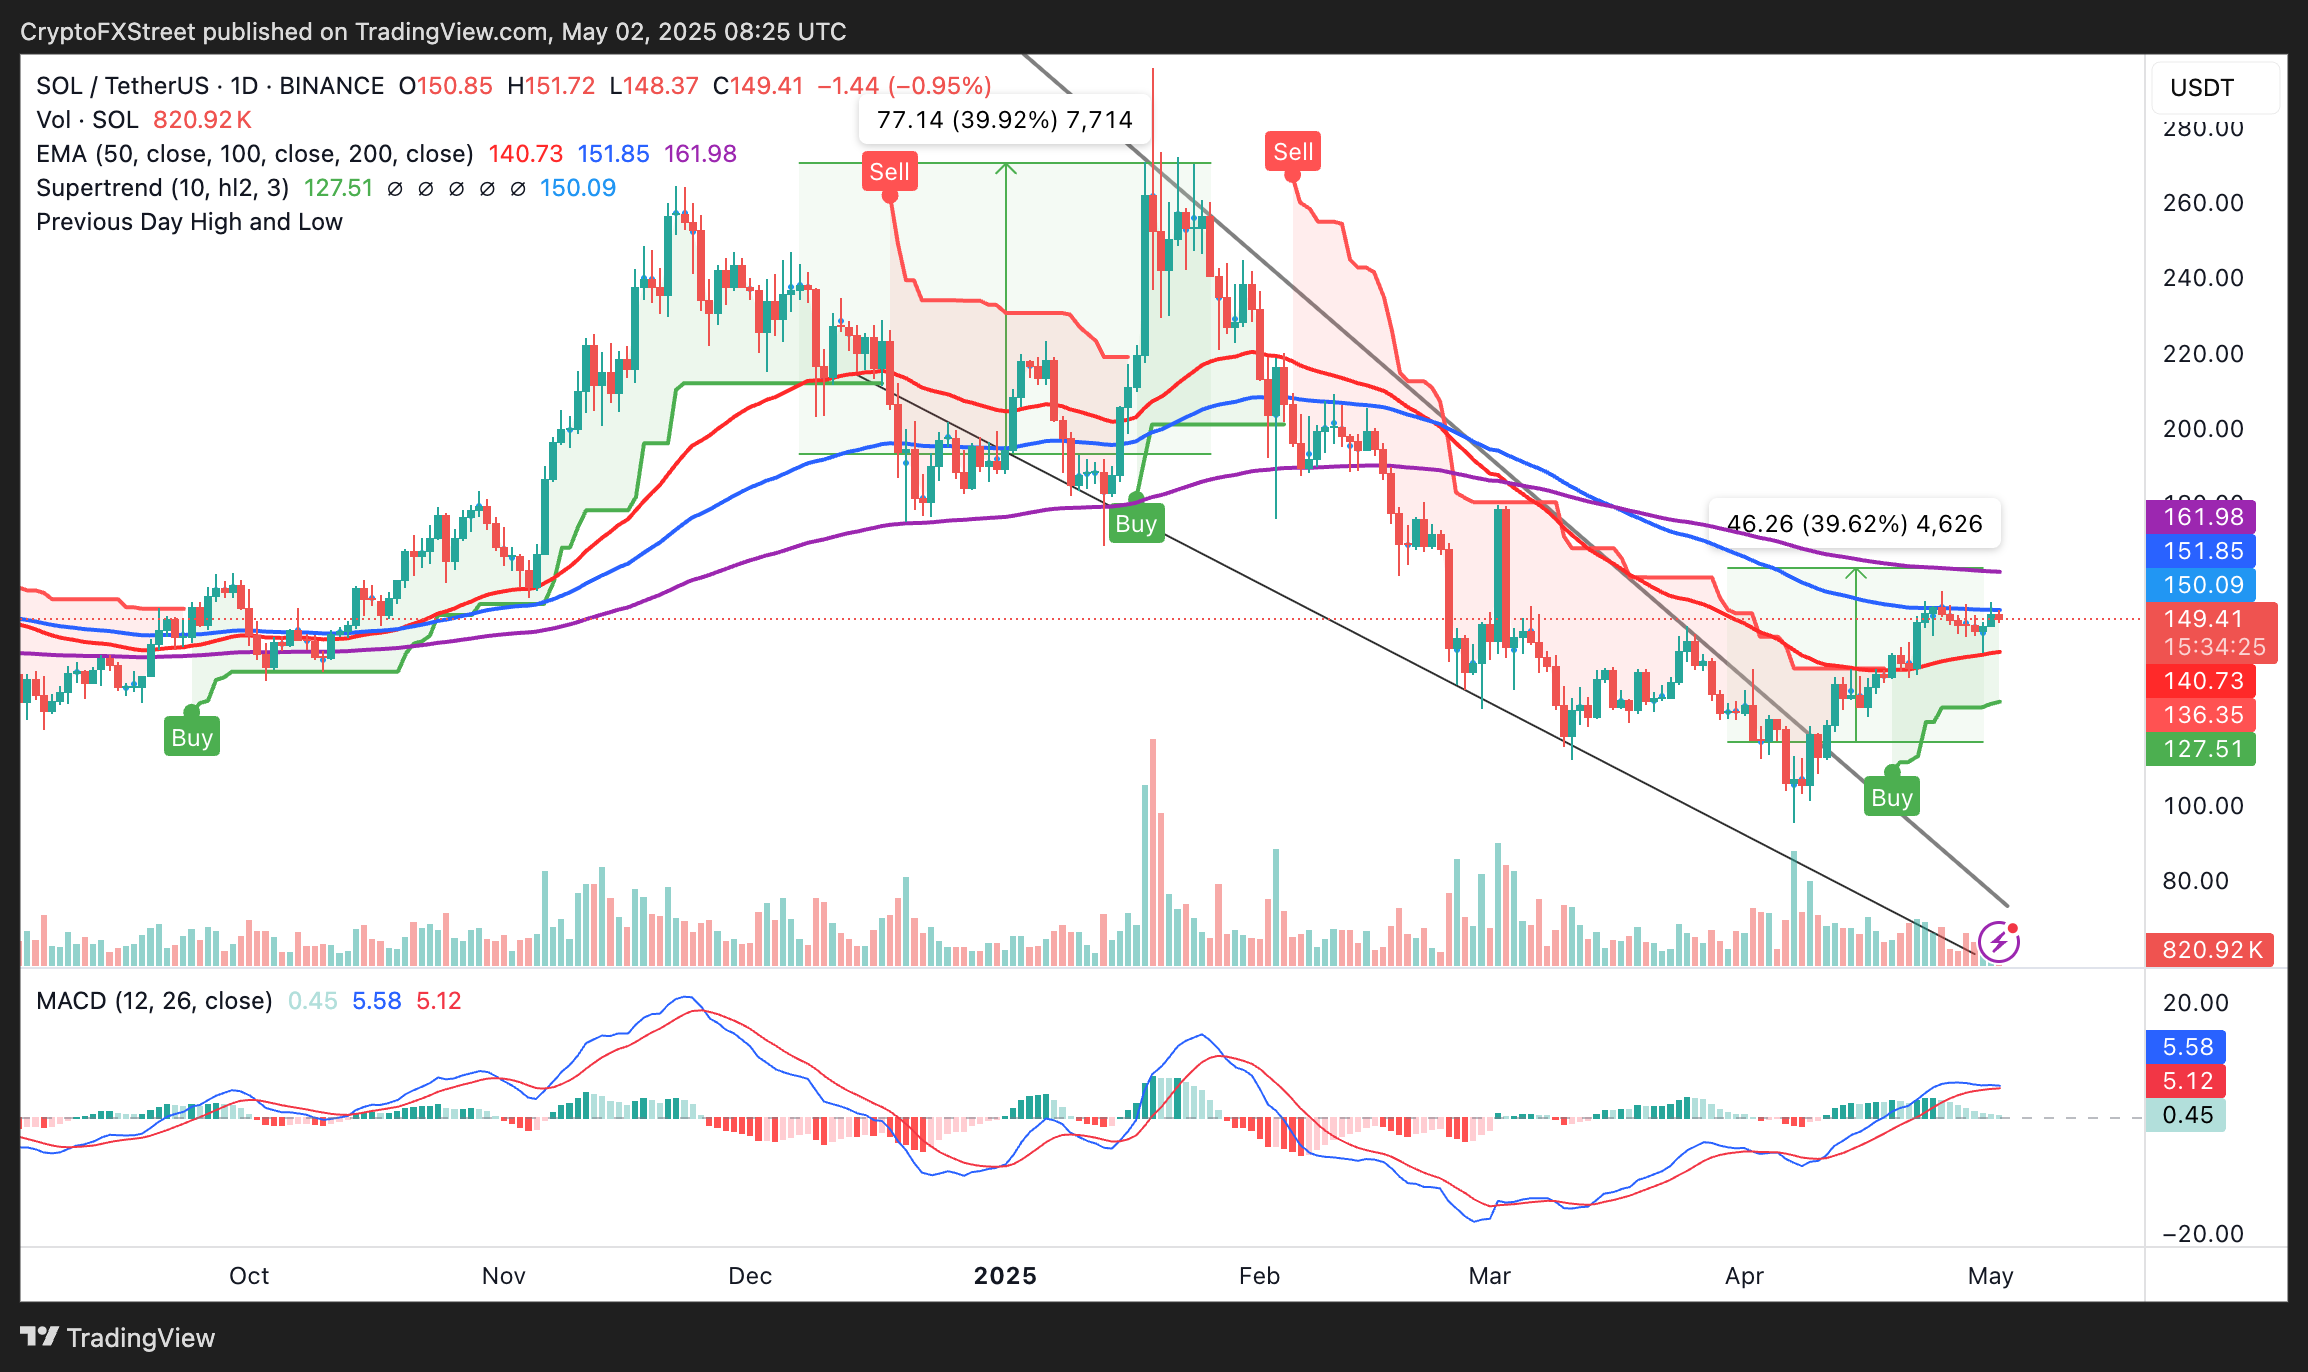
SOL/USDT daily chart
However, with green histograms in the Moving Average Convergence Divergence (MACD) indicator diminishing, Solana’s price could face potential sell-side pressure. Failure to break above $150 in the coming sessions could exhaust bulls, increasing the chances of a pullback. A sell signal would confirm a reversal, with the MACD line (blue) crossing below the signal line (red). Key levels on the downside include the 50-day EMA at $140 and the demand zone at $125.


