


Ethereum price today: $2,520
- Ethereum has seen intense accumulation across whale wallets and ETH ETFs over the past week.
- However its price has stalled, following investors leveraging a delta-neutral play, a strategy that can be accelerated by staking in ETH ETFs.
- ETH is facing rising bearish momentum after seeing a rejection at the 200-day SMA.
Ethereum (ETH) is down 2% on Wednesday amid a simultaneous growth in accumulation and short positioning across ETH futures. The divergence follows investors leveraging a delta-neutral play to scoop yield.
Ethereum risks an extended price slowdown following rising delta-neutral strategy
Ethereum whales expanded their holdings in the past week, scooping about 800K ETH daily, with the balance of 1K-10K wallets surpassing 14.3 million ETH, per Glassnode data.
ETH Whale Net Positions Change. Source: Glassnode
“On June 12 alone, Ethereum whales added over 871K ETH – the highest daily net inflow YTD. This scale of buying hasn’t been seen since 2017,” wrote Glassnode analysts.
Likewise, US spot ETH ETFs recorded weekly net inflows of $528 million last week — their highest since December — and a 19-day inflow streak that ended on Friday, per SoSoValue data.
In the same vein, the total ETH staked has crossed the 35 million mark, representing approximately 29% of the top altcoin’s total supply.
Despite the spot market buying pressure, growing shorts in the Chicago Mercantile Exchange (CME) have been weighing on Ethereum’s price growth in the past weeks. The net positions of hedge funds holding CME Ether futures contracts have reached -$1.55 billion, outpacing the highest long position of $361 million by about $1.2 billion.
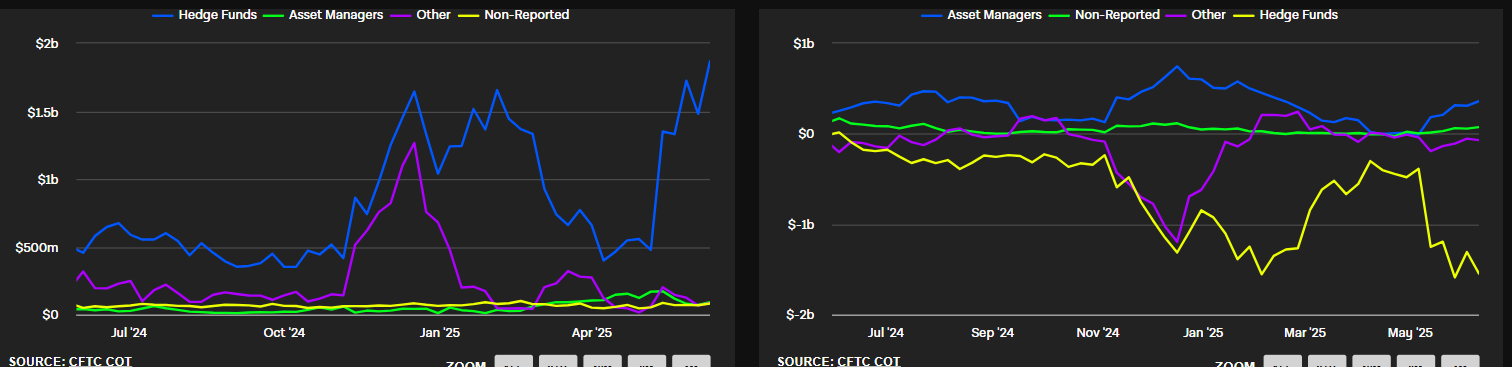
Net Positions of CME ETH Futures. Source: The Block
A similar large short positioning was noticeable on Binance, where shorts grew steadily through May before slowing down in June.
A potential reason for the simultaneous growth in CME shorts and spot buying pressure could be that investors are repeating their delta-neutral play from late Q4 ’24 to early Q1 ’25 to benefit from the ETH basis trade.
A delta-neutral strategy involves an investor balancing their portfolio in a way that minimizes directional risk.
“The ETF inflows signal long exposure, but rising short interest on CME suggests funds are hedging spot positions — which is classic delta-neutral behavior. It’s a sophisticated play on basis, not belief in ETH’s direction,” Mike Cahill, CEO of Douro Labs, told FXStreet.
Douglas Colkitt, Initial Fogo Contributor, echoed a similar sentiment in an exclusive commentary to FXStreet.
“It’s textbook delta-neutral—long the ETF or spot, short the perp, harvest the basis. We saw this in Q1 and it’s clear funds are running that same play again,” he said.
This strategy could be accelerated with the approval of staking by the Securities and Exchange Commission (SEC) in US spot Ethereum ETFs.
“Today investors can buy ETH and sell the futures for a guaranteed 5.5% yield, which would be boosted by another 2.5% should staking rewards come online […] this is almost 2x the risk-free rate and doesn’t expose investors to price risk,” Greg Magdini, Director of Derivatives at Amberdata said in a note to FXStreet.
Cahill also noted that staked ETH ETFs could enhance the delta-neutral play among investors.
“Staked yield in ETFs strengthens the case for delta-neutral plays, since funds can extract the staking return while neutralizing price exposure. It’s a capital-efficient arbitrage loop that now scales through regulated products,” he added.
Colkitt highlighted that delta-neutral could be the default strategy for institutions should the SEC approve staking. “It’s Ethena’s model with TradFi polish. Once ETFs start staking, delta-neutral becomes the institutional default,” Colkitt added.
Ethereum Price Forecast: ETH struggles near $2,500 after rejection at 200-day SMA
Ethereum experienced $107.39 million in futures liquidations, with long and short liquidations totaling $85.11 million and $22.28 million, respectively, over the past 24 hours, according to Coinglass data.
After seeing a rejection at the 200-day Simple Moving Average (SMA), ETH declined briefly below the $2,500 key level before finding support at the 38.2% Fibonacci retracement near $2,450. This Fib level is strengthened by the 50-day SMA dynamic support just above the lower boundary of a key ascending channel.
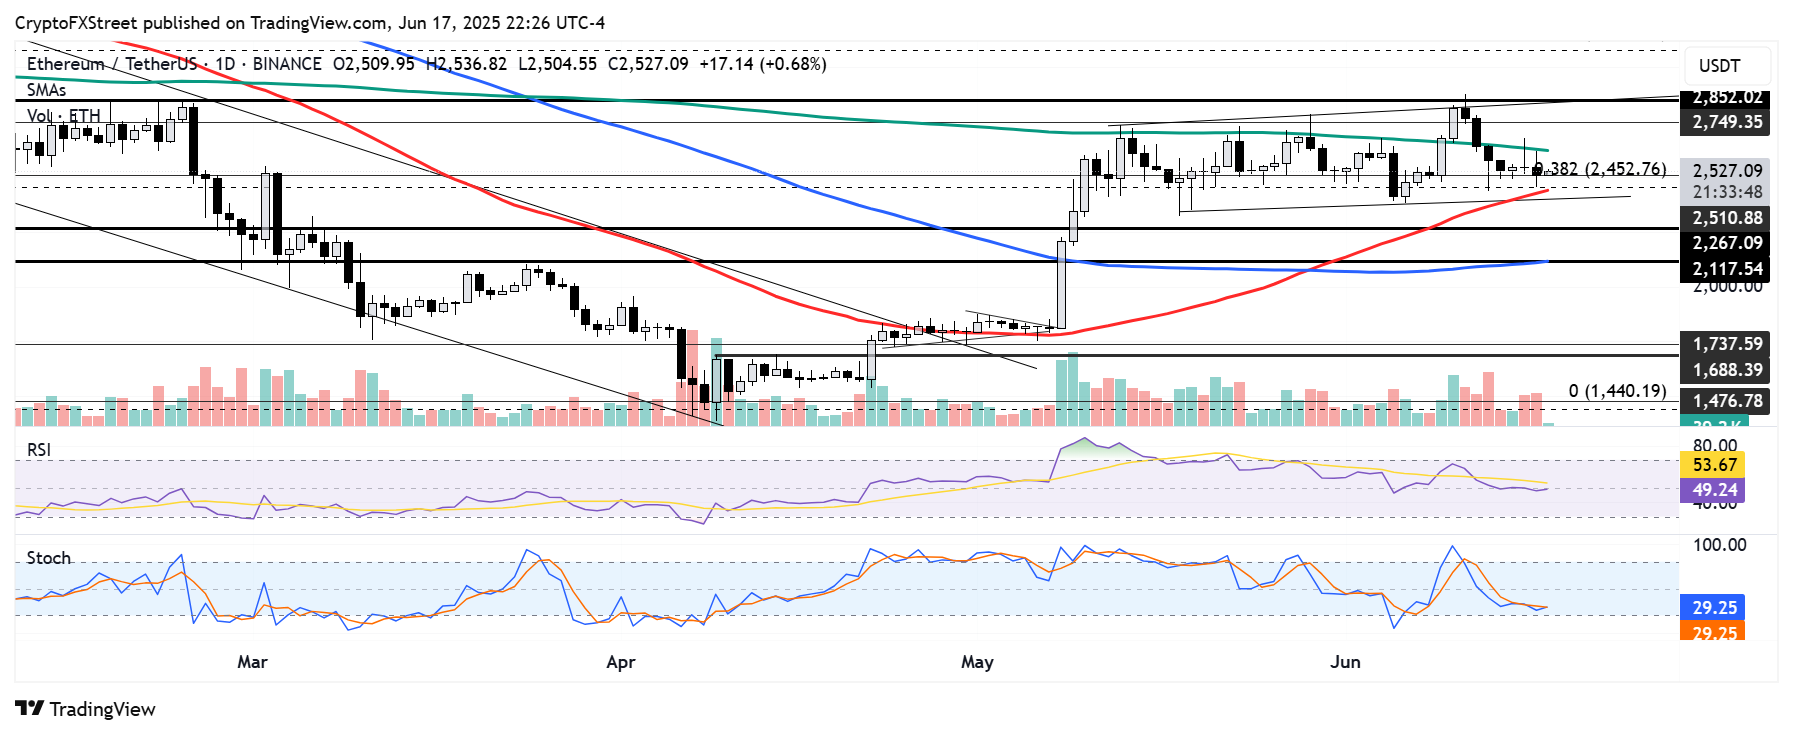
ETH/USDT daily chart
ETH risks a decline toward the $2,260 to $2,100 range, strengthened by the 100-day SMA if it fails to hold the support levels mentioned ealier. A further decline could see the top altcoin moving toward $1,750 to collect liquidity.
On the upside, ETH has to move above and hold $2,800 as support to begin a fresh uptrend.
The Relative Strength Index (RSI) is testing its neutral level, while the Stochastic Oscillator is trending toward the oversold region, indicating rising bearish momentum.


