


Nasdaq Futures tradeCompass Analysis – June 26, 2025
Nasdaq Prediction Summary for Now
Bias: Bullish
Valid While Above: $22,487
Bearish Bias Below: $22,448
Market Status at Time of Analysis: Price at $22,495 (above both today’s and yesterday’s Value Area High)
Trade Compass Levels – Nasdaq Futures (ES)
📈 Bullish Plan (Active if Price Stays Above $22,487)
-
Entry Zone (ideal re-entry on retracement):
-
$22,488 (a re-entry zone above bullish threshold)
-
$22,477 (today’s POC; valid as long as price doesn’t cross bearish threshold)
-
-
Profit Targets for Bulls:
-
$22,513 – 3rd Upper Std Dev of Today’s VWAP
-
$22,534 – Upper Std Dev of Yesterday’s VWAP
-
$22,570 – Near key upside resistance
-
Runner Target: $22,700 – Referenced in our Nasdaq video as part of the broader bullish case
-
-
Stop Consideration:
If entering late (above the threshold), increase your stop buffer and reduce your position size to maintain a responsible risk profile.
📉 Bearish Plan (Only Active Below $22,448)
-
Bearish Threshold Activation:
Triggers once price drops below $22,448, under both today’s VAL and yesterday’s VWAP. -
Profit Targets for Bears:
-
$22,436 – Immediate short-term reaction zone
-
$22,425 – 1st Lower Std Dev of VWAP
-
$22,405 – Just above yesterday’s VAL
-
$22,387 – Support within previous balance area
-
$22,352 – Deeper move target, near structural demand zone
-
Market Context: Waiting for a Catalyst?
The market currently grinds slightly upward, but the tight daily range indicates indecision. With no major earnings this week and reduced geopolitical tension, traders appear to be in wait-and-see mode around the all-time high region.
This explains the closer-than-usual partial profit targets—they reflect tightening volatility and a market potentially preparing for a decisive breakout or rejection. Our map adapts accordingly.
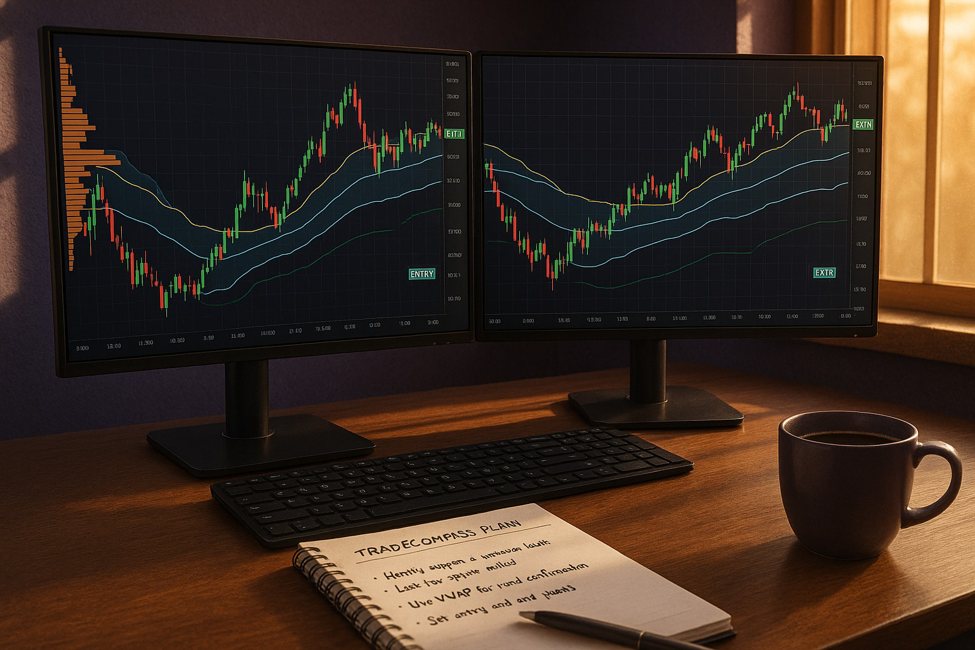
🧭 tradeCompass Methodology – A Quick Primer
Help your trading with tradeCompass by investingLive.com
The Trade Compass system is designed to provide orientation, not prediction. Think of it as your intraday GPS, helping you:
-
Define bias zones: Bullish above, bearish below
-
Adapt to volatility: Partial profits are structured based on current range dynamics
-
Manage risk systematically:
-
Use the Map, Not Your Gut: Every threshold, POC, and deviation line is there for a reason, rooted in volume, VWAPs, and institutional behavior
This system helps both short-term traders and long-term investors avoid emotional trading and instead anchor decisions to real-time price behavior around key levels.
📹 Bonus: Watch the Nasdaq Outlook
In today’s Nasdaq technical analysis video update, we share a broader view of the Nasdaq, including potential moves toward $22,700+ for NASDAQ futures, if momentum continues. Watch it for context and alignment across indices.
🧠 Final Notes for Traders & Investors
-
Be cautious of late entries—they often require wider stops and smaller sizes.
-
Below $22,448 the story changes—bearish plan activates.
-
This region near the all-time high is rich with hesitation and potential traps. Stay disciplined, scale in, and follow the map.
-
Move stops to entry after your second partial to protect capital while still leaving room for a runner.
This analysis is based on the tradeCompass methodology by InvestingLive.com (the new brand of ForexLive.com, coming soon). It is not financial advice. Trade at your own risk.
ForexLive.com
is evolving into
investingLive.com, a new destination for intelligent market updates and smarter
decision-making for investors and traders alike.


