


Fundamental
Overview
As the stock markets around
the world bottomed, the pressure on gold eventually waned and the precious
metal rallied strongly into new all-time highs.
The rally has been
aggressive as everyone rushed into gold as protection from potential
stagflation due to trade wars. The problem is that “long gold” is now the most
crowded trade according to the Bank of America Fund Manager Survey.
In the bigger picture, gold
remains in an uptrend as real yields will likely continue to fall as the bar
for rate hikes remains very high. The risks include another aggressive stock
market selloff or a hawkish Fed.
In the short term, given the
crowded long positions in gold, an easing in the trade war will likely trigger
a deeper correction in the market, so watch out for developments on that front.
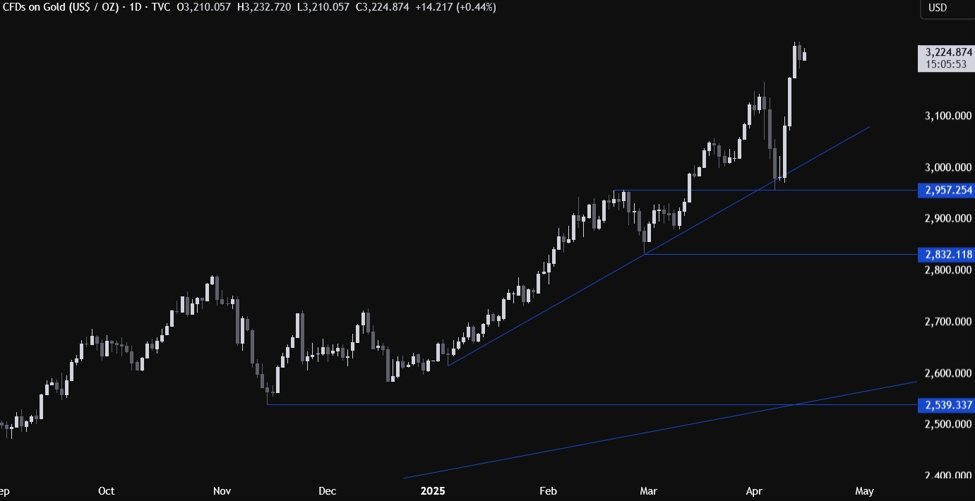
Gold
Technical Analysis – Daily Timeframe
Gold daily
On the daily chart, we can
see that Gold paused its run to the upside around the 3245 level. From a risk
management perspective, the buyers will have a better risk to reward setup
around the trendline
to position for further upside. The sellers, on the other hand, will want to
see the price breaking below the trendline and the 2957 level to extend the
drop into the 2832 level next.
Gold Technical Analysis
– 4 hour Timeframe
Gold 4 hour
On the 4 hour chart, we can
see that the previous all-time high at 3168 could now act as support. That’s where the buyers will likely step in
with a defined risk below the level to position for further upside. The
sellers, on the other hand, will want to see the price breaking lower to pile
in and target a pullback into the 3057 level next.
Gold Technical Analysis
– 1 hour Timeframe
Gold 1 hour
On the 1 hour chart, we can
see that we broke below the minor upward trendline that was defining the
bullish momentum on this timeframe. That’s generally followed by some
consolidation or a pullback. Again, the buyers will likely step in around the
3168 level to keep pushing into new highs, while the sellers will look for a
break lower to target the 3057 level next. The red lines define the average daily range for today.
Upcoming
Catalysts
This week we don’t have much on the agenda and
it’s going to be shortened by the Good Friday holiday. Tomorrow, we have the US
Retail Sales and Fed Chair Powell speaking. On Thursday, we get the latest US
Jobless Claims figures. As a reminder, the market is focused on tariff
negotiations at the moment, so the data is not as market-moving as it used to
be in the past months.


