


Ethereum price today: $2,770
- Ethereum open interest has surged to an all-time high of 15.21 million ETH, spearheaded by Volatility Shares 2x leveraged ETH ETF.
- Ethereum accumulation addresses have recorded inflows above 400K ETH in five of the last seven days.
- ETH challenges the $2,850 resistance as the crossover above its 200-day SMA reinforces the bullish momentum.
Ethereum (ETH) briefly moved above $2,850 on Wednesday following its futures open interest (OI) rising to an all-time high of 15.21 million ETH. The OI rise is accompanied by major inflows into accumulation addresses in the past week.
Ethereum open interest soared to new highs, accumulation addresses inflows surge
Ethereum has seen a 12% gain over the past three days, following a surge in its futures open interest, which jumped by 1.57 million ETH to an all-time high of 15.21 million ETH. Coupled with the OI growth, funding rates have also seen a slight uptick, indicating a rising appetite for risk among ETH investors.
Ethereum open interest. Source: Coinglass
Notably, the Chicago Mercantile Exchange (CME) accounted for the majority of the ETH OI growth among top exchanges, with the Volatility Shares 2x leveraged ETH ETF (ETHU) as the primary source of the increase. This shows that institutional investors are driving the demand for leverage.
Between April 8 and June 9, the ETH equivalent exposure of ETHU increased by 305,100 ETH, while the CME’s ETH OI rose by 295,250 ETH, according to a K33 Research report on Tuesday.
“In other words, without VolatilityShares, CME’s ETH OI would have declined by 9,850 ETH over the past two months. It is concerning to see one single entity cornering such a massive share of the market on CME, and it originates from a bunch of traders thirsting for leveraged long exposure in ETH,” the report states.
Buying pressure in US spot Ethereum ETFs has also been consistent, recording net inflows of $124.93 million on Tuesday and extending their positive streak to 17 consecutive days, according to SoSoValue data.
A similar bullish structure is evident in ETH accumulation addresses, recording large inflows above 400K ETH in five out of the last seven days. Accumulation addresses are addresses that have never sold/distributed any token — with newly created addresses forming a majority of them.
-1749685641701.png)
ETH Inflows into Accumulation Addresses. Source: CryptoQuant
Meanwhile, ETH could see increased volatility with prices rising above $2,800 as it has the second-highest volume and third-largest OI by strike price in the options market, per Laevitas.ch data. An option contract is in the money or in profit if the underlying asset moves above its strike price, increasing the chances of profit-taking.
Ethereum Price Forecast: ETH tackles $2,850 resistance as bullish momentum grows
Ethereum sustained $111.56 million in futures liquidations, with long and short liquidations reaching $64.26 million and $47.29 million, respectively, in the past 24 hours, according to Coinglass data.
After flipping the upper boundary of a key channel, Ethereum briefly moved above the $2,850 key resistance on Wednesday — the first time since February 4.
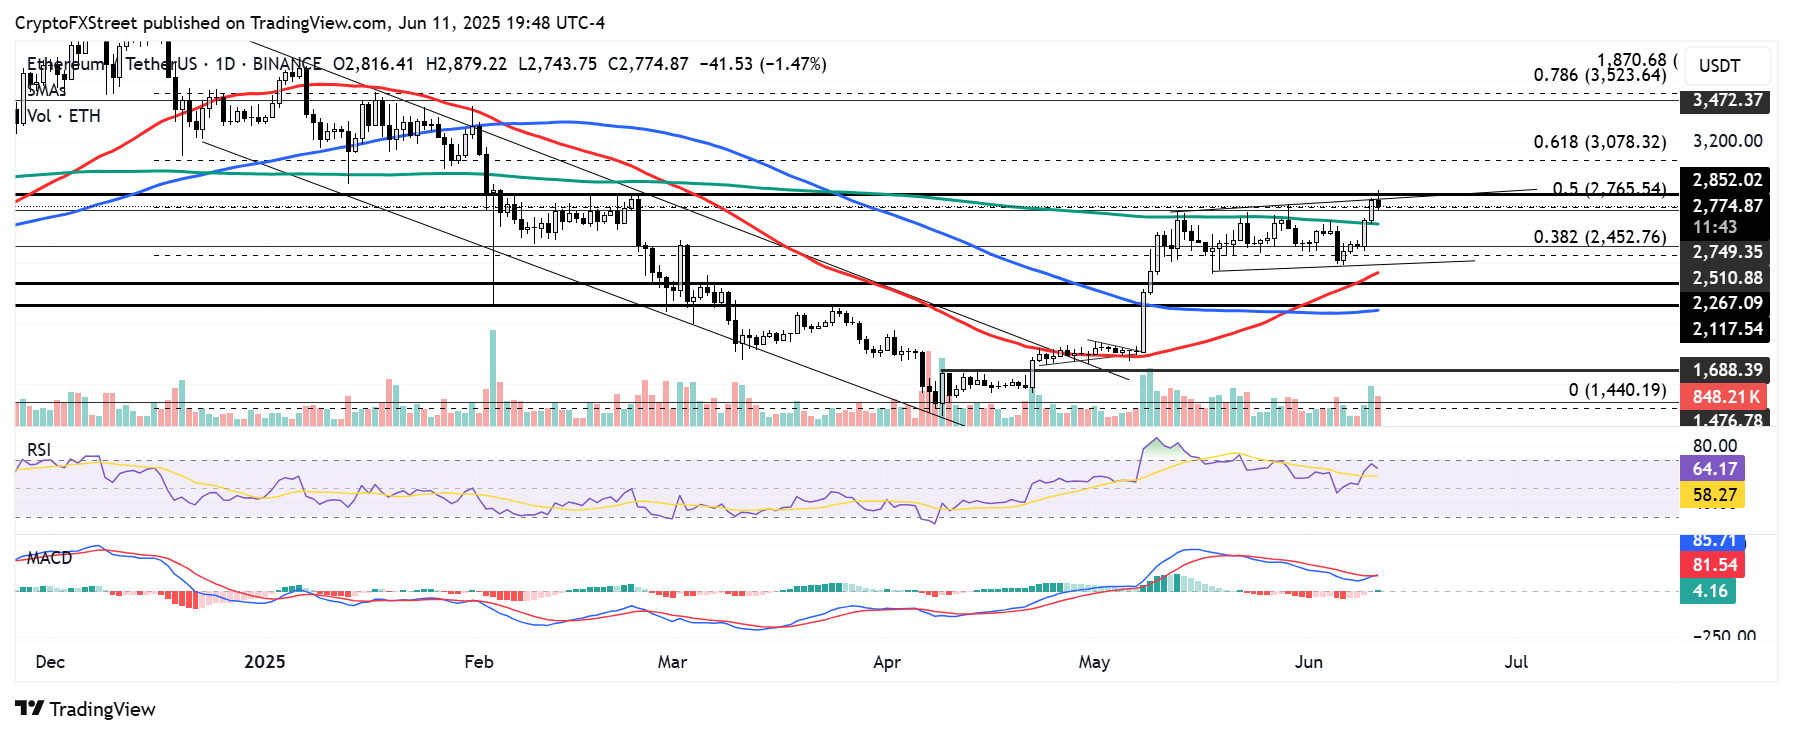
ETH/USDT daily chart
The top altcoin has also risen above the cost basis of about 2.1 million ETH purchased around $2,700 – $2,760, per Glassnode data. On the upside, ETH faces no critical resistance until it approaches the $3,400 level. This also aligns with its cost basis being evenly distributed until it approaches $3,417.
“If the $2.70K–$2.76K support range holds, the path to $3.42K remains technically open – but the response from holders in the $2.8K–$3.3K range will define how quickly $ETH can climb,” noted Glassnode in a Wednesday’s X post.
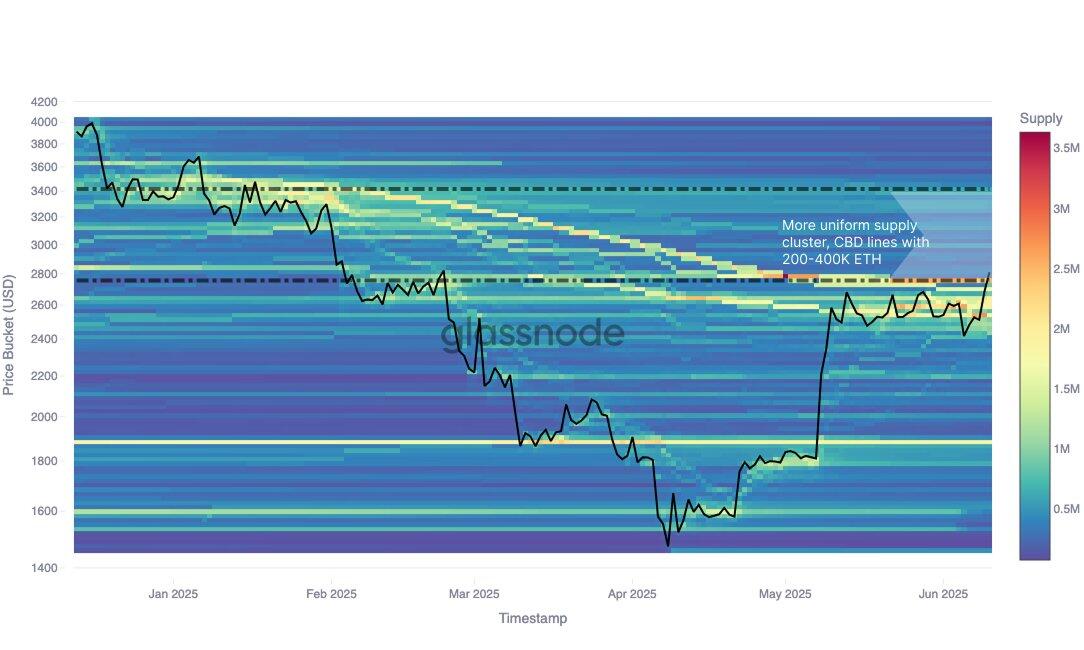
ETH Cost Basis Distribution. Source: Glassnode
In the short term, ETH could see a resistance near the 61.8% Fibonacci retracement at $3,078 if it recovers the $2,850 level. The upward momentum is strengthened by ETH rising above its 200-day Simple Moving Average (SMA), a move that often precedes a strong uptrend for the top altcoin.
On the downside, ETH could find support at the 200-day SMA, if it maintains the rejection at $2,850. A decline below this level could send ETH toward $2,500.
The Relative Strength Index (RSI) is testing its overbought region line. Meanwhile, the Moving Average Convergence Divergence (MACD) is attempting a crossover above its moving average line after its histogram flipped positive. A crossover will strengthen the bullish momentum.


