


Ethereum price today: $2,540
- Ethereum declined 3% after President Trump announced fresh tariffs on the EU and Apple.
- The bullish market structure hasn’t broken yet, supported by strong buying pressure from US spot Ether ETFs and whales.
- ETH could register double-digit losses if it declines below the $2,500 key level.
Ethereum (ETH) is down 3% on Friday, joining the wider crypto market decline following President Trump’s latest tariff threats on the European Union (EU) and Apple. The top altcoin risks extending its losses to double digits if it falls below the $2,500 key level.
Ethereum risks another round of decline if tariff-induced selling rises
Following President Trump’s fresh threats of slapping a 50% tariff on the EU and a 25% levy on Apple phones produced abroad, the crypto market saw a quick correction. Ethereum dropped from a weekly high above $2,700 to below $2,600 at publication time as investors panicked after the announcement from Trump.
After a terrible Q1 underperformance that saw ETH dumping more than 50% following Trump’s reciprocal tariffs on international trading partners, the top altcoin began a recovery in April. Against the backdrop of the US reaching agreements with trading partners and easing tariff fears, Ethereum rallied over 70% from lows of $1,470 on April 7 to near $2,700 on Thursday.
However, with Trump reigniting tariff threats, market sentiment shows signs of flipping bearish heading into the weekend. Ethereum exchange reserves, which have been on a downtrend since April 24, saw a slight uptick of 70K ETH on Friday, per CryptoQuant’s data.
“The tariff announcement revives trade war fears, introducing uncertainty around inflation, FX tensions, and global liquidity,” wrote Bitfinex analysts in a note to FXStreet. “Bitcoin and ETH rallied on spot demand, clean ETF flows, and improving macro optics. That regime is now challenged,” they added.
However, the market hasn’t yet flipped bearish as the recent price decline represents “a macro volatility shock, not a breakdown of crypto market structure,” the analysts noted.
Meanwhile, Ethereum’s subsequent decline after crossing above $2,700 this week extended a trend of ETH experiencing rising selling pressure whenever prices approached the $2,800 key level in the past two weeks.
“There is a significant concentration of investor cost basis levels around the $2,800 level,” Glassnode analysts wrote in a report on Tuesday. “This region is likely to attract increased sell-side pressure, as many investors who were previously underwater may look to de-risk at, or near their break even level, and take some chips off the table.”
ETH Cost-Basis Distribution. Source: Glassnode
Despite signs of de-risking, intense buying pressure from whales and US spot Ether ETF investors could keep the top altcoin afloat heading into the weekend.
US spot ETH ETFs recorded net inflows of $110.54 million on Thursday, their highest daily inflow since February 4, according to data from SoSoValue. The positive flows mark a fifth consecutive day of net inflows for the products. In addition, ETH investors holding between 10K and 100K ETH upped their balance by 450K ETH in the past week, per Santiment data.
Ethereum Price Forecast: ETH eyes double-digit losses if it falls below the $2,500 key level
Ethereum saw $143 million in futures liquidations in the past 24 hours, per Coinglass data. The total amount of liquidated long and short positions is $103.6 million and $39.4 million, respectively.
After rising over 3% on Thursday near the $2,750 resistance of an ascending triangle pattern, ETH saw a rejection. The top altcoin declined by 3% and is struggling to hold the $2,500 key level and the ascending triangle’s rising trendline support. The 50-period Simple Moving Average (SMA) also serves as a dynamic support on the downside.
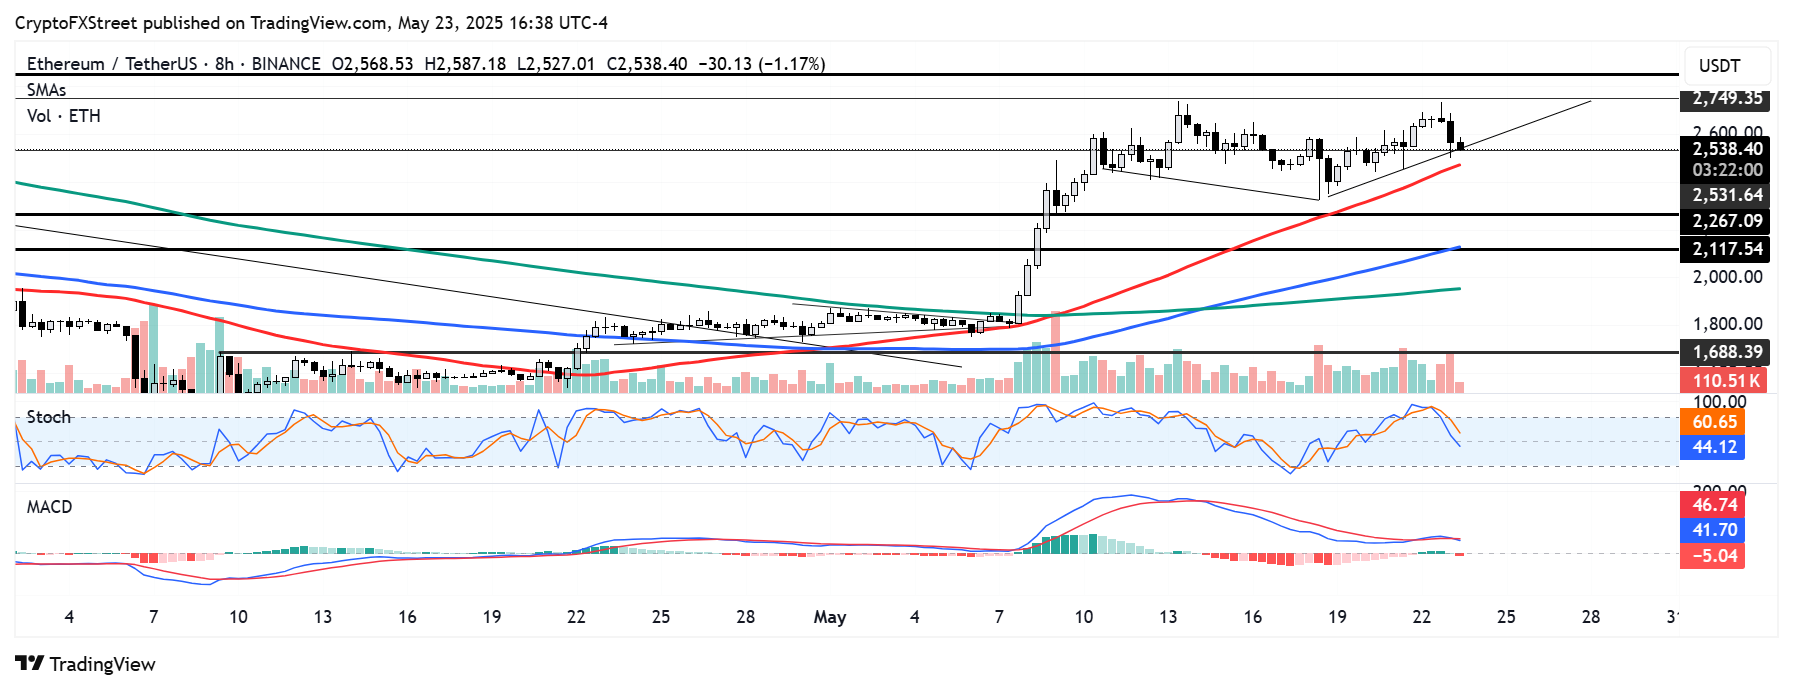
ETH/USDT 8-hour chart
If ETH fails to hold these support levels, it could stretch its decline to the $2,260 – $2,100 key range to register double-digit losses. On the upside, ETH has to clear the resistance around $2,750 – $2,850 to resume an uptrend.
The Stochastic Oscillator (Stoch) has declined from its overbought region, aligning with price corrections that often follow overbought conditions. On the other hand, the Moving Average Convergence Divergence (MACD) flipped to a red histogram bar, signaling an uptick in bearish momentum.


