


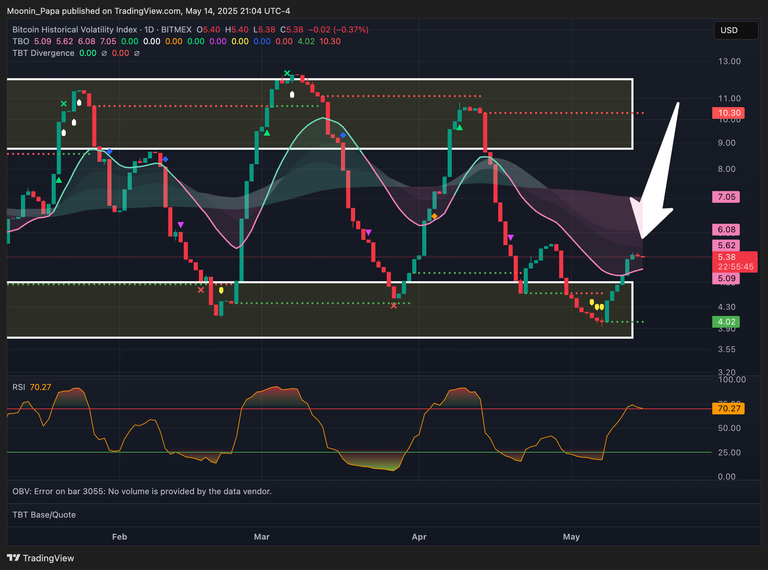
BTC shows resilience, but momentum stalls
After printing a TBO Breakout on Monday, Bitcoin has held above the daily TBO Cloud, keeping its strong bullish status intact. Daily Volume continues to hover around the 30-day moving average, and RSI, while not consistently overbought, remains elevated. OBV is weakening slightly, but the weekly chart remains encouraging. Last week’s candle closed with RSI above 70—a historically bullish trigger—and unless we see a major pullback, this trend looks poised to continue.

ETH outpaces BTC with stronger momentum and volume
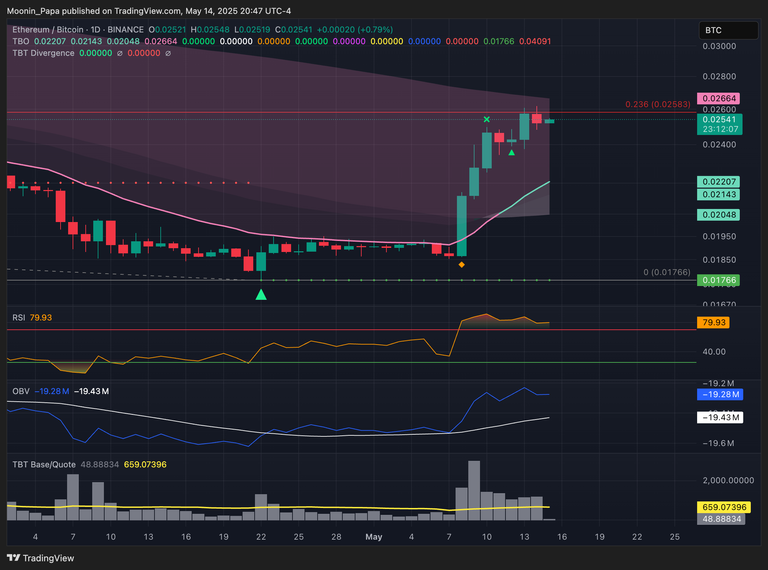
Ethereum is currently outperforming Bitcoin, both in terms of price action and technicals. Daily RSI has stayed overbought for 7 consecutive days, and daily Volume is trending above the 7-day average, pushing OBV’s MA line upward. The weekly chart is especially promising: OBV has made a bullish crossover, RSI is approaching 70, and weekly Volume is on track to exceed the SMA. The ETH/BTC ratio also looks strong, just shy of a close above the 0.236 Fibonacci level, while printing two fresh TBO Breakouts on the 4h.
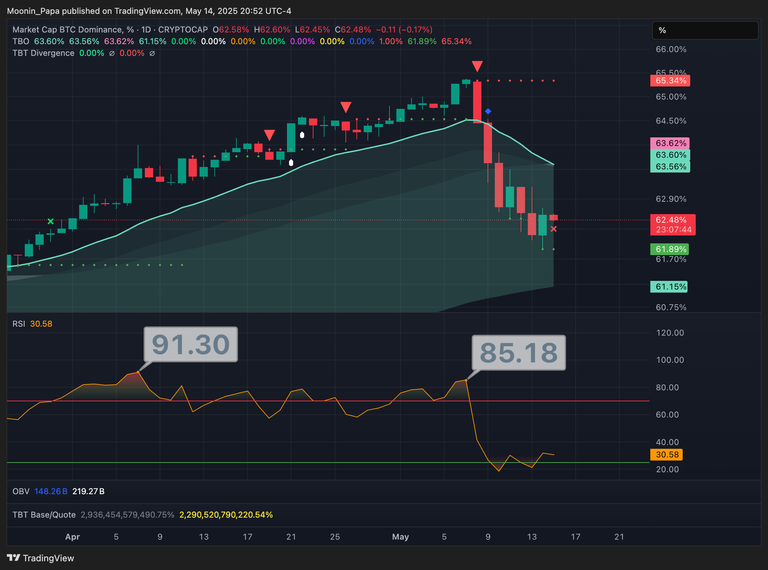
Stablecoin and dominance charts suggest sector rotation
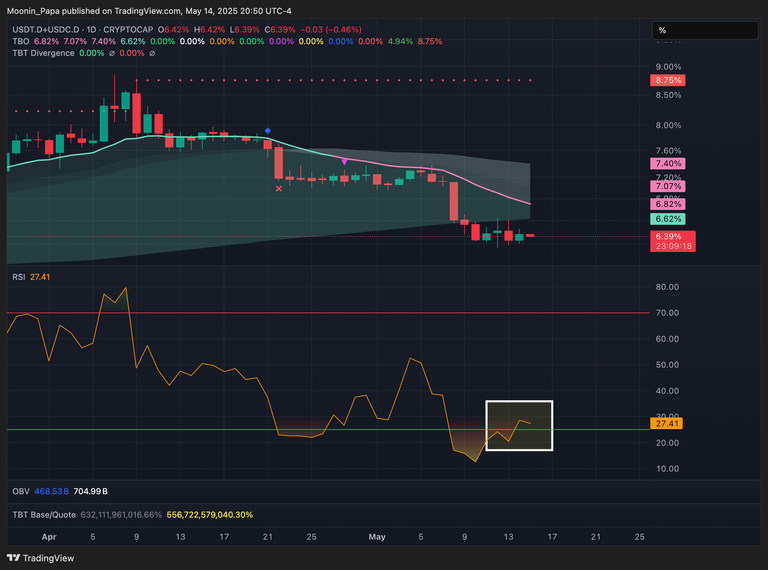
Stablecoin Dominance continues its strong bearish trend, sitting below the daily TBO Cloud despite an RSI Reset—suggesting risk appetite is returning to the market. Meanwhile, Bitcoin Dominance is in bearish consolidation inside the daily Cloud and may soon enter the weekly Cloud for the first time since November 2024. Top 10 Dominance is also chopping within the Cloud, but its weekly RSI is pushing toward a breakout above long-term resistance, indicating possible incoming strength.
OTHERS.D and altcoin sentiment remain intact
OTHERS.D closed down -2.64% and printed a TBO Close Long on the 4h, hinting at a potential short-term trend change. However, the macro picture remains constructive. Volume and OBV continue to look healthy on the daily chart, and weekly Volume has already surpassed its SMA line, showing strong underlying demand.
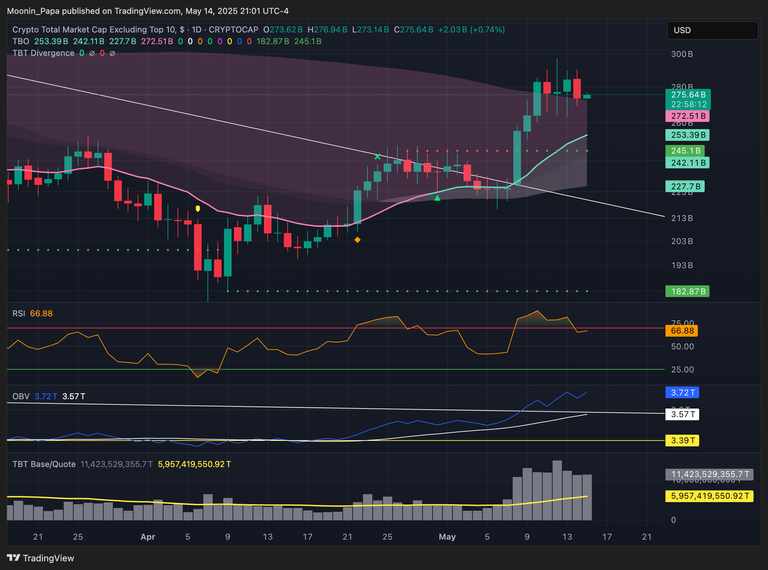
TOTAL and OTHERS market cap charts remain bullish

The TOTAL crypto market cap continues to flash strong bullish signals. Weekly RSI is overbought, Volume is nearing its SMA, and price remains well above the TBO Cloud.
The OTHERS market cap, while slightly down on the day, still looks incredibly strong with daily Volume at 2x the average and weekly Volume exceeding the SMA.
BVOL7D hints at consolidation, not reversal
BVOL7D unexpectedly closed red, suggesting decreasing volatility in the short term. RSI is still overbought but beginning to curl downward. While this doesn’t necessarily imply a bearish reversal, it does suggest we may be entering a brief consolidation phase before the next move.
Gold prints first TBO Close Long since November
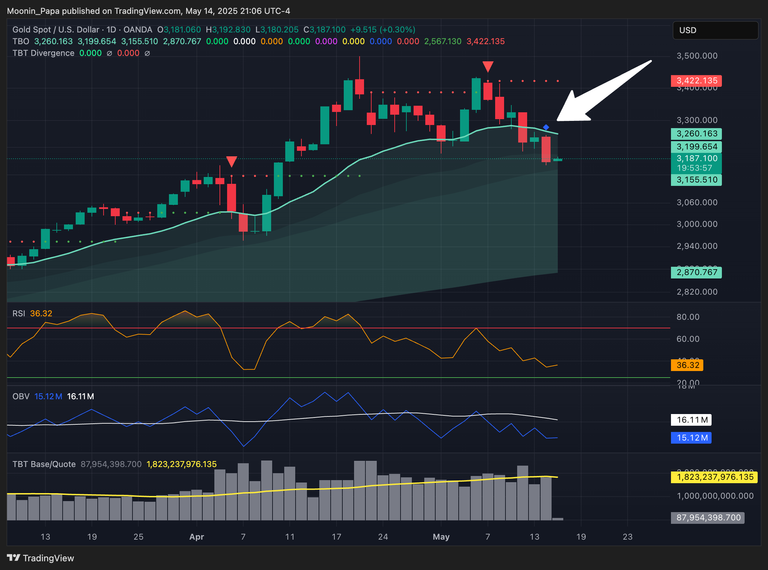
Gold is the only TradFi chart flashing a major signal, with a new TBO Close Long printed on the daily candle—the first since early November. This could be a sign of growing caution or hedging as crypto rallies and macroeconomic tensions continue to simmer.
For in-depth strategy and tools, visit The Complete Cryptocurrency Investor by Mastering Assets.
Disclaimer: The views expressed in this article are those of the author and may not reflect those of Kitco Metals Inc. The author has made every effort to ensure accuracy of information provided; however, neither Kitco Metals Inc. nor the author can guarantee such accuracy. This article is strictly for informational purposes only. It is not a solicitation to make any exchange in commodities, securities or other financial instruments. Kitco Metals Inc. and the author of this article do not accept culpability for losses and/ or damages arising from the use of this publication.


